HOT TOPICS LIST
- MACD
- Fibonacci
- RSI
- Gann
- ADXR
- Stochastics
- Volume
- Triangles
- Futures
- Cycles
- Volatility
- ZIGZAG
- MESA
- Retracement
- Aroon
INDICATORS LIST
LIST OF TOPICS
PRINT THIS ARTICLE
by Dennis D. Peterson
Negative volume index (NVI) claims to be an index that reflects what smart money is doing. Whether it's smart money or not might be debatable, what isn't debatable is whether it can work.
Position: N/A
Dennis D. Peterson
Market index trading on a daily basis.
PRINT THIS ARTICLE
VOLUME
Negative Volume Index
09/28/00 10:24:21 AMby Dennis D. Peterson
Negative volume index (NVI) claims to be an index that reflects what smart money is doing. Whether it's smart money or not might be debatable, what isn't debatable is whether it can work.
Position: N/A
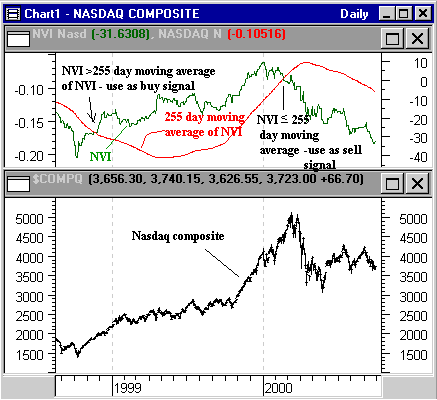
| NVI is based on the premise that on a day when the volume is less than the previous trading day, smart money is taking long positions. None other than Norman Fosback in "Street Market Logic" found that when NVI is used with it's 255-day moving average a signal with a 95% probability can be generated. A bull signal, with 95% probability, occurs when NVI rises above it's one year (255-day) average, and diminishes to 50% when NVI is below it's one year average. |
| When I first started looking into technical analysis by luck I initially "read" Edwards and Magee's "Technical Analysis of Stock Trends". Read is in quotes because I keep re-reading Edwards and Magee. Then I read Fosback. Fosback tends to discount areas of technical analysis that Edwards and Magee would support. One thing that has turned out to be true: if Fosback says it true then you can bank on it. The formula for NVI is the following: If today's volume is less than yesterday's then, NVI=yesterday's NVI+[(close-yesterday's close)/yesterday's close ] *yesterdays's NVI, and if today's volume is greater than or equal to yesterday's volume then, NVI = yesterday's NVI. I used this formula on the Nasdaq composite. In Metastock the formula is: Total Nasdaq Volume = Security("online:$uvolq",C)+Security("online:$dvolq",C)+Security("online:$xvolq",C), and Cum(If( Fml( "Total Nasdaq Volume") < Ref( Fml( "Total Nasdaq Volume"),-1),ROC(Security("online:$compq",C),1,%),0)). The results, as seen in the chart below, were a buy signal generated on 10/29/98 and a sell signal on 2/18/00. As long term buy and sell signals, Fosback certainly called this right. |

|
| Figure 1: Nasdaq and NVI. NVI is higher than it's 255-day moving average on 10/29/98 and less than or equal on 2/18/00. For long term buy and hold signals this is about as good as it gets. |
| Graphic provided by: MetaStock. |
| |
Market index trading on a daily basis.
| Title: | Staff Writer |
| Company: | Technical Analysis, Inc. |
| Address: | 4757 California Ave SW |
| Seattle, WA 98116-4499 | |
| Phone # for sales: | 206 938 0570 |
| Fax: | 206 938 1307 |
| Website: | www.traders.com |
| E-mail address: | dpeterson@traders.com |
Traders' Resource Links | |
| Charting the Stock Market: The Wyckoff Method -- Books | |
| Working-Money.com -- Online Trading Services | |
| Traders.com Advantage -- Online Trading Services | |
| Technical Analysis of Stocks & Commodities -- Publications and Newsletters | |
| Working Money, at Working-Money.com -- Publications and Newsletters | |
| Traders.com Advantage -- Publications and Newsletters | |
| Professional Traders Starter Kit -- Software | |
Click here for more information about our publications!
Comments
Date: / /Rank: Comment: hi looked at nvi formula,,,, little confused,,, formula states use yesterdays nvi? well if you never calculated yesterdays how can you use the formula?????// did I miss something somewere/???? hope you answer me,,,,
Date: / /Rank: 5Comment:

Request Information From Our Sponsors
- StockCharts.com, Inc.
- Candle Patterns
- Candlestick Charting Explained
- Intermarket Technical Analysis
- John Murphy on Chart Analysis
- John Murphy's Chart Pattern Recognition
- John Murphy's Market Message
- MurphyExplainsMarketAnalysis-Intermarket Analysis
- MurphyExplainsMarketAnalysis-Visual Analysis
- StockCharts.com
- Technical Analysis of the Financial Markets
- The Visual Investor
- VectorVest, Inc.
- Executive Premier Workshop
- One-Day Options Course
- OptionsPro
- Retirement Income Workshop
- Sure-Fire Trading Systems (VectorVest, Inc.)
- Trading as a Business Workshop
- VectorVest 7 EOD
- VectorVest 7 RealTime/IntraDay
- VectorVest AutoTester
- VectorVest Educational Services
- VectorVest OnLine
- VectorVest Options Analyzer
- VectorVest ProGraphics v6.0
- VectorVest ProTrader 7
- VectorVest RealTime Derby Tool
- VectorVest Simulator
- VectorVest Variator
- VectorVest Watchdog
