HOT TOPICS LIST
- MACD
- Fibonacci
- RSI
- Gann
- ADXR
- Stochastics
- Volume
- Triangles
- Futures
- Cycles
- Volatility
- ZIGZAG
- MESA
- Retracement
- Aroon
INDICATORS LIST
LIST OF TOPICS
PRINT THIS ARTICLE
by David Penn
The summer rally in gold fails at a Fibonacci retracement level. Will the June lows be tested next?
Position: N/A
David Penn
Technical Writer for Technical Analysis of STOCKS & COMMODITIES magazine, Working-Money.com, and Traders.com Advantage.
PRINT THIS ARTICLE
FIBONACCI
Gold's 61.8% Limit
08/28/06 10:34:38 AMby David Penn
The summer rally in gold fails at a Fibonacci retracement level. Will the June lows be tested next?
Position: N/A
| Talk on Wall Street has shifted from wondering when the Federal Reserve will stop raising rates to serious considerations of when the Fed will actually start lowering them again. I don't know if there could be any stronger evidence of this economy's addiction to low-cost borrowing than this apparent longing of the days when cash rates were scuttling along at all-time lows. |

|
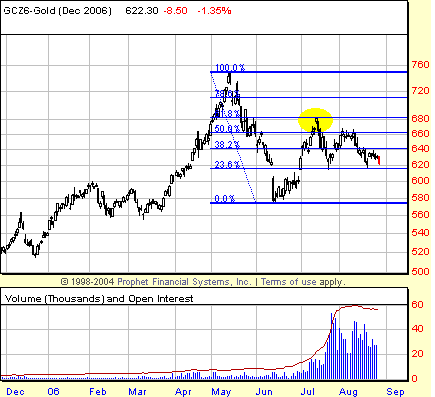
| FIGURE 1: DECEMBER GOLD, DAILY. After falling from a May peak near $740, December gold fell more than 20% before finding support in mid-June. The bounce from that correction saw the futures retrace fully 61.8% of the decline—but meet stiff resistance as well. |
| Graphic provided by: Prophet Financial, Inc. |
| |
| There are a number of barometers that technical analysts can use to determine whether the market itself believes that looser money is more likely than tighter money going forward. One of those barometers is the gold market. Generally speaking, when gold prices are rising it is because the dollar is getting weaker—or because of the perception that policies are in place or will be put in place that will devalue the dollar. The possibility of the Fed moving quickly from a fed funds rate-tightening stance to a fed funds rate-lowering stance would be an example of the kind of policy that would be inclined to devalue the dollar. As such, if the gold market believed that the Fed would soon be adopting a rate-lowering posture, then gold buyers would likely be more aggressive and numerous than gold sellers. |
| So what does Figure 1 tell us? In the context of the past six months, it appears that the gold market has moved from a position of thinking that gold would appreciate versus the dollar to, at best, a position in which those odds have evened up some. The strength in the bond market also argues that the inflationary fears that have helped propel gold higher over the past several months (if not years) have abated, at least somewhat, at least temporarily. |

|
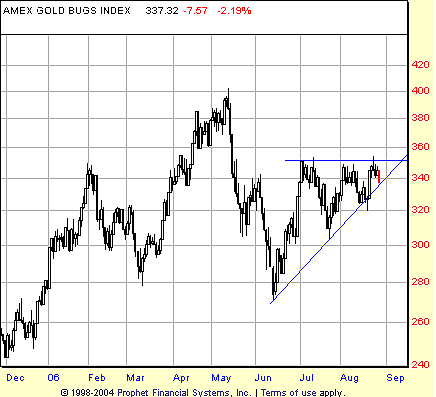
| FIGURE 2: AMEX GOLD BUGS INDEX, DAILY. Higher lows continue to be the case in the gold BUGS index. If this pattern continues, then a breakout to the upside is all but inevitable for gold stocks. |
| Graphic provided by: Prophet Financial, Inc. |
| |
| Clearly, the gold market put in a bottom in June. And since that bottom, the market has made a key higher low in July and, so far, a marginally higher low in August. That makes for an uptrend—however rudimentary. In an uptrend, it's the lows you want to be wary of insofar as "nothing" bad happens as long as there are no lower lows. Conversely, if you are short in a downtrend, it is the highs you want to be watchful for. As long as you don't get higher highs in a downtrend, the path of least resistance will remain lower. |
| A pattern of higher lows is certainly in effect in the gold stocks. Consider the chart of the $HUI, the AMEX gold BUGS index in Figure 2. Here, the pattern of higher lows since the June bottom increasingly looks like an ascending triangle, with a zone of resistance at about 350. This is why a preoccupation with the lows during an uptrend is key. Even in the relative absence of higher highs, a pattern of higher lows creates pressure, as the range of prices grows increasingly narrower. Ultimately, this drop in volatility is resolved with a burst of volatility and, more often than not, a strong price move. While this strong price move can be to the upside or downside, it tends to follow the prevalent (or preceding) trend. In the case of a series of higher lows, that trend—and that strong price move—is most likely upward. |
Technical Writer for Technical Analysis of STOCKS & COMMODITIES magazine, Working-Money.com, and Traders.com Advantage.
| Title: | Technical Writer |
| Company: | Technical Analysis, Inc. |
| Address: | 4757 California Avenue SW |
| Seattle, WA 98116 | |
| Phone # for sales: | 206 938 0570 |
| Fax: | 206 938 1307 |
| Website: | www.Traders.com |
| E-mail address: | DPenn@traders.com |
Traders' Resource Links | |
| Charting the Stock Market: The Wyckoff Method -- Books | |
| Working-Money.com -- Online Trading Services | |
| Traders.com Advantage -- Online Trading Services | |
| Technical Analysis of Stocks & Commodities -- Publications and Newsletters | |
| Working Money, at Working-Money.com -- Publications and Newsletters | |
| Traders.com Advantage -- Publications and Newsletters | |
| Professional Traders Starter Kit -- Software | |
Click here for more information about our publications!
Comments
Date: 08/28/06Rank: 4Comment:
Date: 08/29/06Rank: 5Comment:
Date: 08/30/06Rank: 4Comment:

Request Information From Our Sponsors
- StockCharts.com, Inc.
- Candle Patterns
- Candlestick Charting Explained
- Intermarket Technical Analysis
- John Murphy on Chart Analysis
- John Murphy's Chart Pattern Recognition
- John Murphy's Market Message
- MurphyExplainsMarketAnalysis-Intermarket Analysis
- MurphyExplainsMarketAnalysis-Visual Analysis
- StockCharts.com
- Technical Analysis of the Financial Markets
- The Visual Investor
- VectorVest, Inc.
- Executive Premier Workshop
- One-Day Options Course
- OptionsPro
- Retirement Income Workshop
- Sure-Fire Trading Systems (VectorVest, Inc.)
- Trading as a Business Workshop
- VectorVest 7 EOD
- VectorVest 7 RealTime/IntraDay
- VectorVest AutoTester
- VectorVest Educational Services
- VectorVest OnLine
- VectorVest Options Analyzer
- VectorVest ProGraphics v6.0
- VectorVest ProTrader 7
- VectorVest RealTime Derby Tool
- VectorVest Simulator
- VectorVest Variator
- VectorVest Watchdog
