HOT TOPICS LIST
- MACD
- Fibonacci
- RSI
- Gann
- ADXR
- Stochastics
- Volume
- Triangles
- Futures
- Cycles
- Volatility
- ZIGZAG
- MESA
- Retracement
- Aroon
INDICATORS LIST
LIST OF TOPICS
PRINT THIS ARTICLE
by Gary Grosschadl
High oil prices and travel anxiety add fuel to a breakdown.
Position: Sell
Gary Grosschadl
Independent Canadian equities trader and technical analyst based in Peterborough
Ontario, Canada.
PRINT THIS ARTICLE
DESCENDING TRIANGLES
Boeing Breaks Lower
08/28/06 09:27:01 AMby Gary Grosschadl
High oil prices and travel anxiety add fuel to a breakdown.
Position: Sell
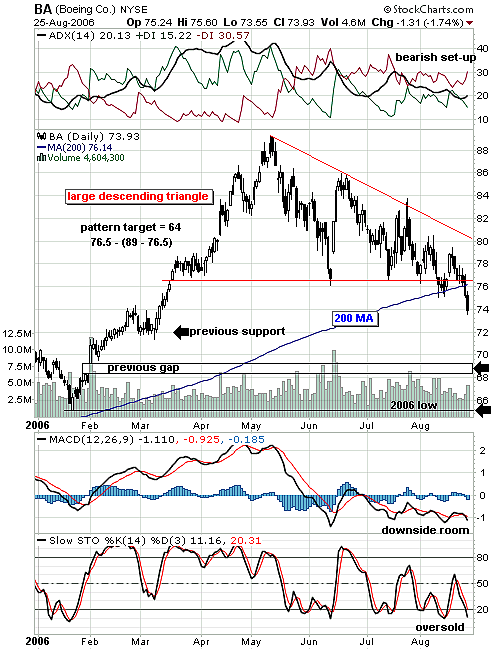
| After having peaked at $89 in May, continuing weakness fed the descending triangle pattern shown on this daily chart of Boeing (BA) (Figure 1). This triangle breakdown was briefly rescued by the nearby 200-day moving average but now has decidedly closed below this support. |
| Having broken below both the lower trendline of this triangle formation and the ever-important 200-day MA, we should consider downside targets. The pattern fulfillment target for this triangle can be calculated by taking the widest part of the triangle and applying this measure to the break below the horizontal trendline. This does not mean that the $64 will be reached, only that the potential exists. There are three possible support levels along the way that could come into play: The decline could pause at previous support at $72, react to gap support near $69, or bounce off the 2006 low near $65. |

|
| FIGURE 1: BOEING, DAILY. This chart of BA shows downside possibilities. |
| Graphic provided by: StockCharts.com. |
| |
| We could consider several indicators. The directional movement indicator at the top of the chart shows its three components in a bearish state. With an upsloping average directional movement index (ADX) line above 20 and -DI (directional index, representing bearish power) overhead, the stage is set for more downside. The moving average convergence/divergence (MACD) is also bearishly under zero and shows some downside room. Meanwhile, the stochastic oscillator reminds us that this condition is now in oversold territory, so a bounce of some sort may not be far off. |
| Where a significant bounce or reversal eventually occurs remains to be seen. A brief pause near 72 and then further weakness to previous gap support or 2006 lows would not be a surprise. |
Independent Canadian equities trader and technical analyst based in Peterborough
Ontario, Canada.
| Website: | www.whatsonsale.ca/financial.html |
| E-mail address: | gwg7@sympatico.ca |
Click here for more information about our publications!
Comments

Request Information From Our Sponsors
- VectorVest, Inc.
- Executive Premier Workshop
- One-Day Options Course
- OptionsPro
- Retirement Income Workshop
- Sure-Fire Trading Systems (VectorVest, Inc.)
- Trading as a Business Workshop
- VectorVest 7 EOD
- VectorVest 7 RealTime/IntraDay
- VectorVest AutoTester
- VectorVest Educational Services
- VectorVest OnLine
- VectorVest Options Analyzer
- VectorVest ProGraphics v6.0
- VectorVest ProTrader 7
- VectorVest RealTime Derby Tool
- VectorVest Simulator
- VectorVest Variator
- VectorVest Watchdog
- StockCharts.com, Inc.
- Candle Patterns
- Candlestick Charting Explained
- Intermarket Technical Analysis
- John Murphy on Chart Analysis
- John Murphy's Chart Pattern Recognition
- John Murphy's Market Message
- MurphyExplainsMarketAnalysis-Intermarket Analysis
- MurphyExplainsMarketAnalysis-Visual Analysis
- StockCharts.com
- Technical Analysis of the Financial Markets
- The Visual Investor
