HOT TOPICS LIST
- MACD
- Fibonacci
- RSI
- Gann
- ADXR
- Stochastics
- Volume
- Triangles
- Futures
- Cycles
- Volatility
- ZIGZAG
- MESA
- Retracement
- Aroon
INDICATORS LIST
LIST OF TOPICS
PRINT THIS ARTICLE
by Paolo Pezzutti
A trend is about to emerge in the short and intermediate time frames. A breakout technique might prove to be effective.
Position: N/A
Paolo Pezzutti
Author of the book "Trading the US Markets - A Comprehensive Guide to US Markets for International Traders and Investors" - Harriman House (July 2008)
PRINT THIS ARTICLE
BOLLINGER BANDS
EUR/USD In A Tight Trading Range
08/28/06 09:18:53 AMby Paolo Pezzutti
A trend is about to emerge in the short and intermediate time frames. A breakout technique might prove to be effective.
Position: N/A
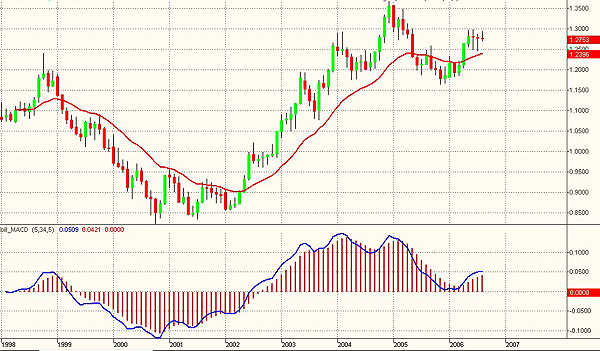
| In Figure 1, you can see the EUR/USD monthly chart. Prices started an uptrend in 2002, moving from the 0.85 level to a high of about 1.36 at the end of 2004. Since then, prices gave way to a correction that brought prices to a relative low of about 1.1638 in November 2005. Since then, the dollar has weakened to retest the 1.30, so far without success. |

|
| FIGURE 1: EUR/USD, MONTHLY. Prices have reached the 1.30 resistance, without enough strength so far to retest previous highs. |
| Graphic provided by: TradeStation. |
| |
| After 25 months and 17 straight meetings of quarter-percentage-point increases in benchmark interest rates, at the last meeting, the Federal Open Market Committee (FOMC) decided to hold rates steady. The move gives them time to see whether they have raised interest rates enough to cool inflationary pressures, or whether they have put growth at risk by raising rates too much. The decision keeps the Fed's fed funds rate at 5.25%. The market does not have a unique interpretation of the move, because the FOMC kept open all the options. Further tightening would depend on the economic data, because inflation risks remain. On one hand, the Fed gives the signal that they are still in tightening mode and are just taking a break. On the other hand, they may believe that the economy will slow, making any more rate hikes unnecessary. The European central bank, in the meanwhile, is providing signals of increasing interest rates after the promising data about growth in Europe and, in particular, Germany. In addition, the international crisis in the Middle East is not influencing prices. |

|
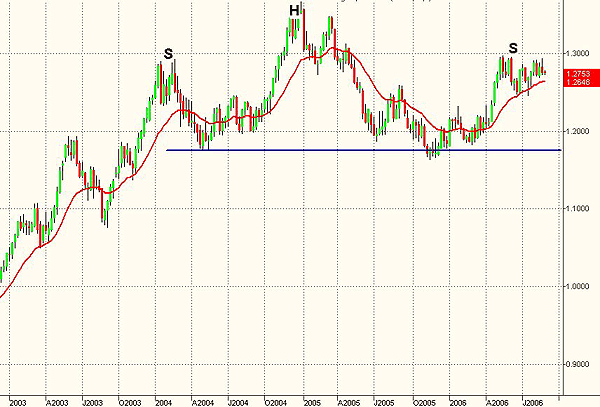
| FIGURE 2: EUR/USD WEEKLY. The dollar has been moving in a trading range during the past two years. A bearish head & shoulders might be forming, although this scenario is unlikely for the moment. A breakout of the neckline would project prices to the 1.05 objective. |
| Graphic provided by: TradeStation. |
| |
| The effects of these different scenarios is not affecting the dollar moves much. The two hanging man candlestick patterns printed in the monthly chart in June and July, however, indicate that 1.30 is a significant resistance to be overcome before retesting the 1.35 top. The patterns show that the euro might not have the strength to print new highs at the moment. |
| In Figure 2, the weekly chart displays the trading range environment that has been developing during the past two years. Since last May, prices are moving within a tight range between 1.25 and 1.30. In the monthly and weekly time frames, a bearish head & shoulders might be forming. It is too early to say, and most of all it is against all popular predictions about a weak dollar. But if the formation is confirmed with prices below 1.20–1.18, the objective would be at about 1.05. |

|
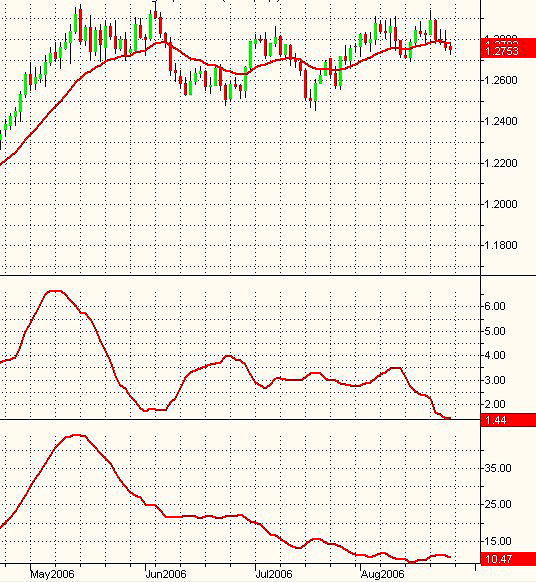
| FIGURE 3: EUR/USD, DAILY. The extremely low values of the ADX and BandWidth indicators display the lack of an ongoing trend, but also that volatility and directionality should increase in the short and intermediate time frame. |
| Graphic provided by: TradeStation. |
| |
| This uncertain situation and lack of trendiness despite all the forecasts about a weak dollar, which appeared in the press during the past two years, is even clearer in the daily time frame. In Figure 3, you can see that the average directional movement index (ADX) has the extremely low value of 10.47. The ADX measures the trend quality of a security, independent of direction. The greater the ADX value, the stronger a security is trending. Traditionally, values above 30 are assumed to indicate an ongoing trend. A value of 10 indicates the lack of an ongoing trend. You can see also an important indicator derived from the Bollinger Bands: BandWidth, which is a relative measure of the width of the bands. This indicator is calculated subtracting the lower band from the upper band and then normalizing the result after you divide it by the middle band: Band width = (Upper band - Lower band)/Middle band. The width of the bands is expressed as a percent of the moving average. This indicator can be used in several ways. When the bands get very narrow, you can expect an expansion in volatility in the near future. If volatility falls to extremely low levels, that situation is a forecast of a sudden increase in volatility and a new sustained trend. This indicator allows you to spot the beginning of directional trends that are born in trading ranges. A breakout from the trading range is characterized by a sharp increase of BandWidth. In Figure 3, the BandWidth indicator is at the level of 1.44, the lowest printed in the past years. Such a fall in volatility to extremely low levels suggests a sudden increase in volatility and a trend in the near future. It is quite impossible to anticipate the direction of the next move, but applying breakout techniques in this situation might be effective from the risk–reward perspective. |
Author of the book "Trading the US Markets - A Comprehensive Guide to US Markets for International Traders and Investors" - Harriman House (July 2008)
| Address: | VIA ROBERTO AGO 26 POSTAL CODE 00166 |
| Rome, ITALY | |
| Phone # for sales: | +393357540708 |
| E-mail address: | pezzutti.paolo@tiscali.it |
Click here for more information about our publications!
PRINT THIS ARTICLE

Request Information From Our Sponsors
- StockCharts.com, Inc.
- Candle Patterns
- Candlestick Charting Explained
- Intermarket Technical Analysis
- John Murphy on Chart Analysis
- John Murphy's Chart Pattern Recognition
- John Murphy's Market Message
- MurphyExplainsMarketAnalysis-Intermarket Analysis
- MurphyExplainsMarketAnalysis-Visual Analysis
- StockCharts.com
- Technical Analysis of the Financial Markets
- The Visual Investor
- VectorVest, Inc.
- Executive Premier Workshop
- One-Day Options Course
- OptionsPro
- Retirement Income Workshop
- Sure-Fire Trading Systems (VectorVest, Inc.)
- Trading as a Business Workshop
- VectorVest 7 EOD
- VectorVest 7 RealTime/IntraDay
- VectorVest AutoTester
- VectorVest Educational Services
- VectorVest OnLine
- VectorVest Options Analyzer
- VectorVest ProGraphics v6.0
- VectorVest ProTrader 7
- VectorVest RealTime Derby Tool
- VectorVest Simulator
- VectorVest Variator
- VectorVest Watchdog
