HOT TOPICS LIST
- MACD
- Fibonacci
- RSI
- Gann
- ADXR
- Stochastics
- Volume
- Triangles
- Futures
- Cycles
- Volatility
- ZIGZAG
- MESA
- Retracement
- Aroon
INDICATORS LIST
LIST OF TOPICS
PRINT THIS ARTICLE
by David Penn
A look at how a symmetrical triangle in sugar futures heralded the end of a major rally.
Position: N/A
David Penn
Technical Writer for Technical Analysis of STOCKS & COMMODITIES magazine, Working-Money.com, and Traders.com Advantage.
PRINT THIS ARTICLE
TRIANGLES
The Sugar Triangle
08/25/06 03:31:16 PMby David Penn
A look at how a symmetrical triangle in sugar futures heralded the end of a major rally.
Position: N/A
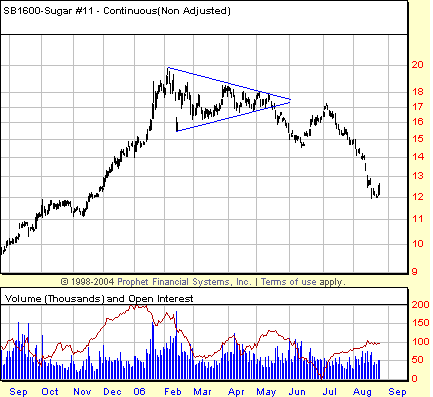
| I've written recently about symmetrical triangles ("The Google Triangle," August 23; "The Copper Triangle," August 25). In both of those cases, the triangles in question were prebreakout, so there was a significant degree of uncertainty whether prices would move upward once they broke free from the pair of converging trendlines that make up the symmetrical triangle pattern, or whether prices would move downward. See Figure 1. |

|
| FIGURE 1: SUGAR, CONTINUOUS FUTURES, WEEKLY. A symmetrical triangle after a major rally in sugar futures forms as a top rather than as a continuation pattern. Note how prices break down, then rally back to the breakdown level before resuming the downside break, reaching and surpassing the minimum downside projection for the triangle. |
| Graphic provided by: Prophet Financial, Inc. |
| |
| I pointed out that, generally speaking, triangles in general and symmetrical triangles in particular tend to function as continuation patterns. By that, I mean that the trend that was in effect before the development of a triangular consolidation will likely be the trend that resumes once prices break free from the pattern. Insofar as the trends leading into the symmetrical triangles in Google and copper futures were upward, I believed that both markets deserved the benefit of the doubt to the upside. But I thought it would be worthwhile to point out that symmetrical triangles can also function as tops, ending and reversing trends rather than helping continue them. One example of such a symmetrical triangle is the consolidation that occurred in sugar futures at the beginning of this year. |
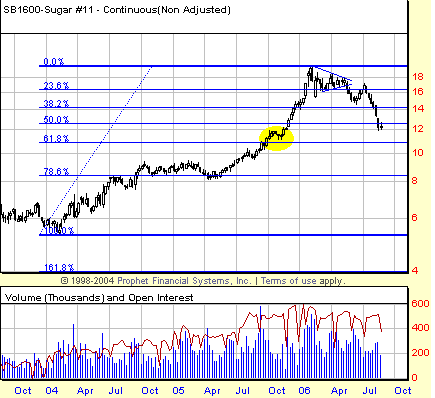
| Sugar had been in a particularly strong bull market going into 2006. This bull market can be traced back to at least February 2004, when the market bottomed after a year-long correction. From a correction low of 5.34 (basis continuous futures), sugar futures were up to 9.13 a year later in February 2005 (a gain of more than 70%), and a year after that they were trading in excess of 17 (Figure 2). These are tremendous gains in a relatively short term and there are no doubt some very happy traders at the New York Board of Trade. It was truly a trend trader's delight. But there is an end to all things, including career-making rallies in sugar. In the first few months of 2006, the sugar market began moving sideways. And this movement was not just sideways, but featured lower highs and higher lows from February into May. This sort of pattern, as I pointed out in the articles I mentioned about Google and copper, is characteristic of a symmetrical triangle. The only question that remained was whether the breakout would be to the upside or the downside. |

|
| FIGURE 2: SUGAR, CONTINUOUS FUTURES, WEEKLY. One likely resting place for the decline in sugar is the 61.8% retracement level, which coincides with a short-term correction low from the autumn of 2005. |
| Graphic provided by: Prophet Financial, Inc. |
| |
| As it happened, sugar broke down rather than out. By mid-May, just as prices looked ready to overrun the triangle, the market broke down below the 17-cent level and continued moving down until mid-June, where it rebounded at approximately the 14.75 level. The bounce lasted only for a few weeks, and brought sugar futures back to the breakdown level just north of 17. This was as good as it got as sugar futures promptly reversed, moving back below the initial, postbreakdown low between 14 and 15 to reach a low of 12 cents by mid-August. |
| How did this breakdown compare with the projection from the symmetrical triangle? With a formation size of approximately 4.28—or 3.54, if we throw out the February 13 candlestick shown in Figure 2 as a data error—and a breakdown level of 17, we get a downside projection of between 12.72 and 13.46. In other words, as far as the minimum downside projection in sugar is concerned, mission accomplished. At this point, sugar has retraced just a bit more than 50% of its rally from the February 2004 lows. A likely finishing point might be a Fibonacci 61.8% retracement, which would take sugar closer to the 11-cent level, and potential support in the form of the November 2005 correction lows. |
Technical Writer for Technical Analysis of STOCKS & COMMODITIES magazine, Working-Money.com, and Traders.com Advantage.
| Title: | Technical Writer |
| Company: | Technical Analysis, Inc. |
| Address: | 4757 California Avenue SW |
| Seattle, WA 98116 | |
| Phone # for sales: | 206 938 0570 |
| Fax: | 206 938 1307 |
| Website: | www.Traders.com |
| E-mail address: | DPenn@traders.com |
Traders' Resource Links | |
| Charting the Stock Market: The Wyckoff Method -- Books | |
| Working-Money.com -- Online Trading Services | |
| Traders.com Advantage -- Online Trading Services | |
| Technical Analysis of Stocks & Commodities -- Publications and Newsletters | |
| Working Money, at Working-Money.com -- Publications and Newsletters | |
| Traders.com Advantage -- Publications and Newsletters | |
| Professional Traders Starter Kit -- Software | |
Click here for more information about our publications!
Comments
Date: 08/25/06Rank: 3Comment:

|

Request Information From Our Sponsors
- StockCharts.com, Inc.
- Candle Patterns
- Candlestick Charting Explained
- Intermarket Technical Analysis
- John Murphy on Chart Analysis
- John Murphy's Chart Pattern Recognition
- John Murphy's Market Message
- MurphyExplainsMarketAnalysis-Intermarket Analysis
- MurphyExplainsMarketAnalysis-Visual Analysis
- StockCharts.com
- Technical Analysis of the Financial Markets
- The Visual Investor
- VectorVest, Inc.
- Executive Premier Workshop
- One-Day Options Course
- OptionsPro
- Retirement Income Workshop
- Sure-Fire Trading Systems (VectorVest, Inc.)
- Trading as a Business Workshop
- VectorVest 7 EOD
- VectorVest 7 RealTime/IntraDay
- VectorVest AutoTester
- VectorVest Educational Services
- VectorVest OnLine
- VectorVest Options Analyzer
- VectorVest ProGraphics v6.0
- VectorVest ProTrader 7
- VectorVest RealTime Derby Tool
- VectorVest Simulator
- VectorVest Variator
- VectorVest Watchdog
