HOT TOPICS LIST
- MACD
- Fibonacci
- RSI
- Gann
- ADXR
- Stochastics
- Volume
- Triangles
- Futures
- Cycles
- Volatility
- ZIGZAG
- MESA
- Retracement
- Aroon
INDICATORS LIST
LIST OF TOPICS
PRINT THIS ARTICLE
by Arthur Hill
Large caps are taking the initiative as the S&P 100 outperforms both the NASDAQ and the S&P SmallCap Index.
Position: Hold
Arthur Hill
Arthur Hill is currently editor of TDTrader.com, a website specializing in trading strategies, sector/industry specific breadth stats and overall technical analysis. He passed the Society of Technical Analysts (STA London) diploma exam with distinction is a Certified Financial Technician (CFTe). Prior to TD Trader, he was the Chief Technical Analyst for Stockcharts.com and the main contributor to the ChartSchool.
PRINT THIS ARTICLE
REL. STR COMPARATIVE
Large Are Leading
08/25/06 08:40:59 AMby Arthur Hill
Large caps are taking the initiative as the S&P 100 outperforms both the NASDAQ and the S&P SmallCap Index.
Position: Hold
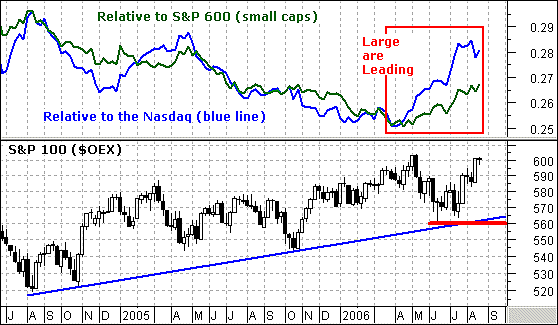
| Relative performance is important, and the Standard & Poor's 100 is leading the S&P SmallCap Index and NASDAQ in 2006. The S&P 100 represents stocks with the largest market capitalizations, and these include General Electric, ExxonMobil, Johnson & Johnson, Microsoft, and Pfizer. These companies have market capitalizations in excess of $190 billion. The NASDAQ represents the technology sector and the S&P SmallCap Index represents small-cap stocks. There is some overlap between the S&P 100 and NASDAQ, but none between the S&P 100 and S&P SmallCap Index (Figure 1). |

|
| FIGURE 1: SMALL CAPS, NASDAQ, OEX. The price relatives for the small caps and the NASDAQ have risen sharply since April (red box). |
| Graphic provided by: MetaStock. |
| |
| The top indicators show the price relative, and this shows the performance of OEX with regard to the S&P SmallCap Index and NASDAQ. It is a simple ratio plot of OEX divided by the other index. OEX leads when the price relative rises and lags when the price relative declines. As you can see from Figure 1, both price relatives have risen sharply since April 2006 (red box). Prior to that, both price relatives declined from April 2005 to April 2006. OEX has clearly taken charge over the last four to five months. |
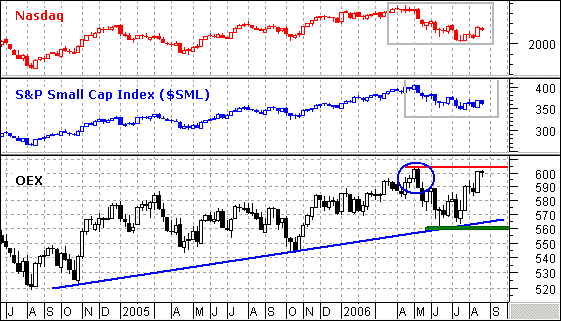
| We can also see relative strength just by looking at price levels. In Figure 2, we can see that OEX is currently challenging its May high, while the NASDAQ and S&P SmallCap Index remain well below their May highs (gray boxes). In fact, these two indexes have yet to even break above their June highs. |

|
| FIGURE 2: NASDAQ, SMALL CAP, OEX. OEX remains in an uptrend, but there is resistance around 600. |
| Graphic provided by: MetaStock. |
| |
| OEX remains in an uptrend, but there is considerable resistance around 600. The index moved above 600 in May and abruptly reversed the very next week with a long black candlestick (blue oval). The index closed above 600 in mid-August and stalled the very next week. A little stalling is acceptable and a break above 605 would affirm the bull. A failure to break above 600 would bring about the possibility of a double top, which is a bearish reversal pattern. However, this pattern would not be confirmed unless the index breaks the July low at 560. |
Arthur Hill is currently editor of TDTrader.com, a website specializing in trading strategies, sector/industry specific breadth stats and overall technical analysis. He passed the Society of Technical Analysts (STA London) diploma exam with distinction is a Certified Financial Technician (CFTe). Prior to TD Trader, he was the Chief Technical Analyst for Stockcharts.com and the main contributor to the ChartSchool.
| Title: | Editor |
| Company: | TDTrader.com |
| Address: | Willem Geetsstraat 17 |
| Mechelen, B2800 | |
| Phone # for sales: | 3215345465 |
| Website: | www.tdtrader.com |
| E-mail address: | arthurh@tdtrader.com |
Traders' Resource Links | |
| TDTrader.com has not added any product or service information to TRADERS' RESOURCE. | |
Click here for more information about our publications!
Comments
Date: 08/25/06Rank: 4Comment:

Request Information From Our Sponsors
- StockCharts.com, Inc.
- Candle Patterns
- Candlestick Charting Explained
- Intermarket Technical Analysis
- John Murphy on Chart Analysis
- John Murphy's Chart Pattern Recognition
- John Murphy's Market Message
- MurphyExplainsMarketAnalysis-Intermarket Analysis
- MurphyExplainsMarketAnalysis-Visual Analysis
- StockCharts.com
- Technical Analysis of the Financial Markets
- The Visual Investor
- VectorVest, Inc.
- Executive Premier Workshop
- One-Day Options Course
- OptionsPro
- Retirement Income Workshop
- Sure-Fire Trading Systems (VectorVest, Inc.)
- Trading as a Business Workshop
- VectorVest 7 EOD
- VectorVest 7 RealTime/IntraDay
- VectorVest AutoTester
- VectorVest Educational Services
- VectorVest OnLine
- VectorVest Options Analyzer
- VectorVest ProGraphics v6.0
- VectorVest ProTrader 7
- VectorVest RealTime Derby Tool
- VectorVest Simulator
- VectorVest Variator
- VectorVest Watchdog
