HOT TOPICS LIST
- MACD
- Fibonacci
- RSI
- Gann
- ADXR
- Stochastics
- Volume
- Triangles
- Futures
- Cycles
- Volatility
- ZIGZAG
- MESA
- Retracement
- Aroon
INDICATORS LIST
LIST OF TOPICS
PRINT THIS ARTICLE
by David Penn
A symmetrical triangle in copper futures sets up the possibility for a dramatic increase in volatility when prices break free.
Position: N/A
David Penn
Technical Writer for Technical Analysis of STOCKS & COMMODITIES magazine, Working-Money.com, and Traders.com Advantage.
PRINT THIS ARTICLE
TRIANGLES
The Copper Triangle
08/25/06 08:55:09 AMby David Penn
A symmetrical triangle in copper futures sets up the possibility for a dramatic increase in volatility when prices break free.
Position: N/A
| The last time I wrote about copper futures was back in February 2006 ("Can Copper Be Topped?" February 23, 2006; Traders.com Advantage). There were a number of things I wrote in that article that are worth recalling. But what sticks out months later is the note that the "big dip in the MACD histogram" that occurred in February was "more likely a buying opportunity rather than a warning of lower prices to come." I predicated this idea on copper's ability to remain above its 50-day exponential moving average (EMA). |

|
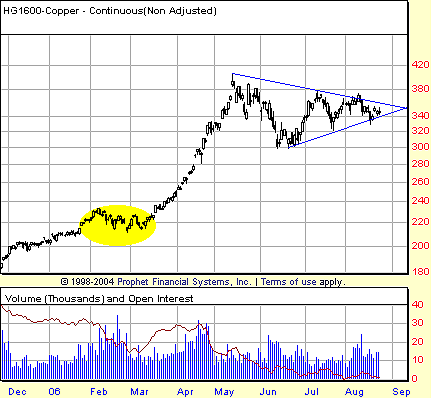
| FIGURE 1: COPPER, CONTINUOUS FUTURES. The correction early in the spring of 2006 set up a dizzying rally that saw copper prices surge by more than 80% by May. |
| Graphic provided by: Prophet Financial, Inc. |
| |
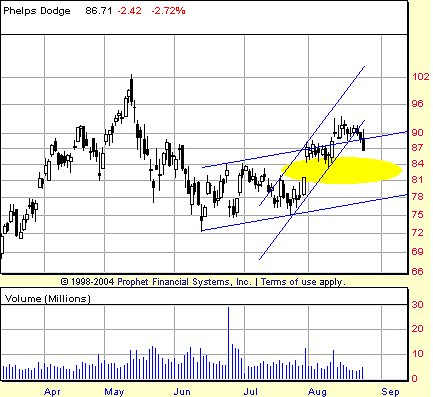
| Not too shabby, copper. From a correction low of 209.70 on February 27 (basis July futures), copper prices soared to a closing high of 392.30 on May 11 in a virtually flawless rally (Figure 1). A copper stock like Phelps Dodge (PD) rallied from about 63 in March to an intraday high of 103 by May (Figure 2). |
| Since those thrilling days, however, copper futures have slipped into a sideways consolidation. This consolidation has consisted of the sort of lower highs and higher lows, all bound by a pair of converging trendlines that is reminiscent of a symmetrical triangle. This symmetrical triangle begins with the May peak and is bound by the lower highs in July and August and the higher lows in June and July. |

|
| FIGURE 2: PHELPS DODGE, DAILY. If leading copper stock Phelps Dodge is able to hold above the gap zone between 84 and 81, then the likelihood of copper breaking out to the upside—from an intermarket perspective—will be that much greater. |
| Graphic provided by: Prophet Financial, Inc. |
| |
| As I wrote recently of the triangle in Google ("The Google Triangle," August 23, 2006), these patterns are generally as likely to lead to upside breakouts as downside breakdowns. The chief caveat, however, is that like many consolidations, they are often resolved in the same direction as the trend that led into the consolidation. If a consolidation appears after an uptrend, then there is a strong possibility that the consolidation will be resolved with an upside breakout. |
| All else aside, that notion defines copper right now. Prices have moved deeply into the tightest part of the triangle, which could make the pattern invalid if a breakout—to the upside or to the downside—does not occur soon. The upside projection for the triangle is about 440. The downside projection for the triangle is 240. Interestingly, the 240 downside projection would take copper back down to the level of the early February highs, just before the two-month correction that paved the way for the bull market in copper that spring. |
Technical Writer for Technical Analysis of STOCKS & COMMODITIES magazine, Working-Money.com, and Traders.com Advantage.
| Title: | Technical Writer |
| Company: | Technical Analysis, Inc. |
| Address: | 4757 California Avenue SW |
| Seattle, WA 98116 | |
| Phone # for sales: | 206 938 0570 |
| Fax: | 206 938 1307 |
| Website: | www.Traders.com |
| E-mail address: | DPenn@traders.com |
Traders' Resource Links | |
| Charting the Stock Market: The Wyckoff Method -- Books | |
| Working-Money.com -- Online Trading Services | |
| Traders.com Advantage -- Online Trading Services | |
| Technical Analysis of Stocks & Commodities -- Publications and Newsletters | |
| Working Money, at Working-Money.com -- Publications and Newsletters | |
| Traders.com Advantage -- Publications and Newsletters | |
| Professional Traders Starter Kit -- Software | |
Click here for more information about our publications!
Comments
Date: 08/25/06Rank: 3Comment:

Request Information From Our Sponsors
- StockCharts.com, Inc.
- Candle Patterns
- Candlestick Charting Explained
- Intermarket Technical Analysis
- John Murphy on Chart Analysis
- John Murphy's Chart Pattern Recognition
- John Murphy's Market Message
- MurphyExplainsMarketAnalysis-Intermarket Analysis
- MurphyExplainsMarketAnalysis-Visual Analysis
- StockCharts.com
- Technical Analysis of the Financial Markets
- The Visual Investor
- VectorVest, Inc.
- Executive Premier Workshop
- One-Day Options Course
- OptionsPro
- Retirement Income Workshop
- Sure-Fire Trading Systems (VectorVest, Inc.)
- Trading as a Business Workshop
- VectorVest 7 EOD
- VectorVest 7 RealTime/IntraDay
- VectorVest AutoTester
- VectorVest Educational Services
- VectorVest OnLine
- VectorVest Options Analyzer
- VectorVest ProGraphics v6.0
- VectorVest ProTrader 7
- VectorVest RealTime Derby Tool
- VectorVest Simulator
- VectorVest Variator
- VectorVest Watchdog
