HOT TOPICS LIST
- MACD
- Fibonacci
- RSI
- Gann
- ADXR
- Stochastics
- Volume
- Triangles
- Futures
- Cycles
- Volatility
- ZIGZAG
- MESA
- Retracement
- Aroon
INDICATORS LIST
LIST OF TOPICS
PRINT THIS ARTICLE
by David Penn
Is the Great Goog-angle tradable?
Position: N/A
David Penn
Technical Writer for Technical Analysis of STOCKS & COMMODITIES magazine, Working-Money.com, and Traders.com Advantage.
PRINT THIS ARTICLE
TRIANGLES
The Google Triangle
08/23/06 02:48:43 PMby David Penn
Is the Great Goog-angle tradable?
Position: N/A
| There's been a pickup in talk about Google lately. Much of this conversation likely was sparked by continued reports of sizable insider selling of the company's shares. A colleague tells me that this selling has been going on for some time and, thus, any contemporary reports shouldn't be that surprising to anyone who was really paying attention. |

|
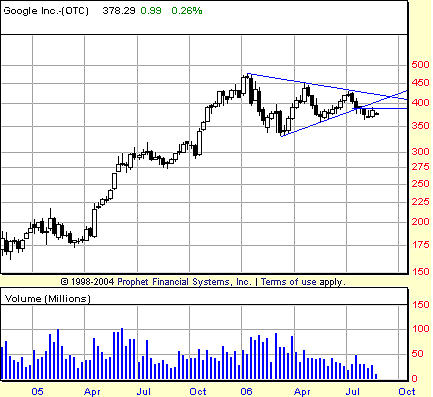
| FIGURE 1: GOOGLE, WEEKLY. This symmetrical triangle in the weekly chart of GOOG began just as 2006 began. Note the multiple touches of both the upper and lower converging trendlines, and the declining volume over the course of the pattern. As of the third quarter of 2006, GOOG has begun breaking down from the triangle. |
| Graphic provided by: Prophet Financial, Inc. |
| |
| GOOG has formed a pretty significant symmetrical triangle over the past several months, and the resolution of that triangle in the form of a breakout to the upside or a breakdown to the downside over the next several weeks probably will go a long way toward writing major chapters in the story of the Little Search Engine That Could. Because the formation over the past half year is a symmetrical triangle, with price action contained within a pair of converging trendlines, there is virtually as good a possibility of higher prices for shares of Google as there is of lower prices. |
| As such, there are arguments that support both bullish and bearish expectations as to how this triangle will be resolved, the most bullish being the fact that consolidations in trends tend to lead to more trend. In other words, consolidations in trends often serve as way stations, places for the rally (or decline) to take a break before resuming their movement in the previous direction. That would argue for higher GOOG prices over the next several weeks. |

|
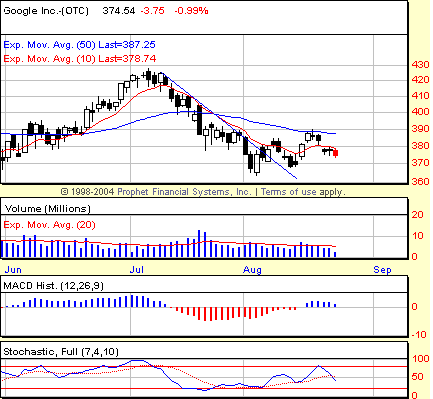
| FIGURE 2: GOOGLE, DAILY. A rally above 390 would be a significantly bullish event for Google insofar as the 390 level represents a source of proven resistance. |
| Graphic provided by: Prophet Financial, Inc. |
| |
| On the weekly chart (Figure 1), GOOG remains above its 50-week moving average, which is a positive. GOOG has tested its 50-week moving average twice since the peak in January. The first bounce off of this support on the week ended March 24 produced a 19.8% gain after four weeks. The second bounce off of this support occurred with the week ended June 9, and produced a 10.8% gain after four weeks. The third bounce off of the 50-week exponential moving average (EMA) occurred with the week ended August 18. As of this writing, shares of Google have yet to rally above the highs of that week. |
| There are bearish aspects to the triangle as well, namely that GOOG appears to have broken down below the lower boundary of the pattern. As clear as this is on the weekly chart, the daily chart (Figure 2) provides some more clues and shorter-term levels of potential support and resistance that anyone trading Google should be aware of. For example, on the daily chart, Google is below its 50-day EMA—and has recently slipped below its 10-day EMA as well. GOOG has spent August moving largely sideways after its most recent decline from the July highs. A daily close above the most recent minor high near 390 would be the first step in changing this sideways movement into a potential reversal. A daily close below the August lows (approximately 363) would bolster the case for lower prices. |
Technical Writer for Technical Analysis of STOCKS & COMMODITIES magazine, Working-Money.com, and Traders.com Advantage.
| Title: | Technical Writer |
| Company: | Technical Analysis, Inc. |
| Address: | 4757 California Avenue SW |
| Seattle, WA 98116 | |
| Phone # for sales: | 206 938 0570 |
| Fax: | 206 938 1307 |
| Website: | www.Traders.com |
| E-mail address: | DPenn@traders.com |
Traders' Resource Links | |
| Charting the Stock Market: The Wyckoff Method -- Books | |
| Working-Money.com -- Online Trading Services | |
| Traders.com Advantage -- Online Trading Services | |
| Technical Analysis of Stocks & Commodities -- Publications and Newsletters | |
| Working Money, at Working-Money.com -- Publications and Newsletters | |
| Traders.com Advantage -- Publications and Newsletters | |
| Professional Traders Starter Kit -- Software | |
Click here for more information about our publications!
Comments
Date: 08/23/06Rank: 3Comment:

Request Information From Our Sponsors
- StockCharts.com, Inc.
- Candle Patterns
- Candlestick Charting Explained
- Intermarket Technical Analysis
- John Murphy on Chart Analysis
- John Murphy's Chart Pattern Recognition
- John Murphy's Market Message
- MurphyExplainsMarketAnalysis-Intermarket Analysis
- MurphyExplainsMarketAnalysis-Visual Analysis
- StockCharts.com
- Technical Analysis of the Financial Markets
- The Visual Investor
- VectorVest, Inc.
- Executive Premier Workshop
- One-Day Options Course
- OptionsPro
- Retirement Income Workshop
- Sure-Fire Trading Systems (VectorVest, Inc.)
- Trading as a Business Workshop
- VectorVest 7 EOD
- VectorVest 7 RealTime/IntraDay
- VectorVest AutoTester
- VectorVest Educational Services
- VectorVest OnLine
- VectorVest Options Analyzer
- VectorVest ProGraphics v6.0
- VectorVest ProTrader 7
- VectorVest RealTime Derby Tool
- VectorVest Simulator
- VectorVest Variator
- VectorVest Watchdog
