HOT TOPICS LIST
- MACD
- Fibonacci
- RSI
- Gann
- ADXR
- Stochastics
- Volume
- Triangles
- Futures
- Cycles
- Volatility
- ZIGZAG
- MESA
- Retracement
- Aroon
INDICATORS LIST
LIST OF TOPICS
PRINT THIS ARTICLE
by Dennis D. Peterson
This article is reprinted from Technical Analysis of Stocks & Commodities magazine, Volume 10, Issue 5 to supplement my recent article "Forecast Oscillator".
Position: N/A
Dennis D. Peterson
Market index trading on a daily basis.
PRINT THIS ARTICLE
Setting Up an Excel Spreadsheet for the Forecast Oscillator
10/26/00 03:49:17 PMby Dennis D. Peterson
This article is reprinted from Technical Analysis of Stocks & Commodities magazine, Volume 10, Issue 5 to supplement my recent article "Forecast Oscillator".
Position: N/A
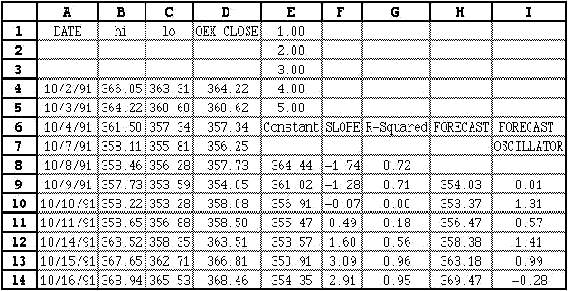
| Following is an example of setting up an Excel spreadsheet for creating a forecast oscillator using a five-day linear regression for tomorrow's close. |
| Figure 1, Column A, lists the dates and Column D lists the closing prices (the Y variables) used for the forecasted close. Cells El through E5 are the constants used for the X variables. |

|
| Figure 1: Sample Excel spreadsheet for creating a forecast. |
| |
| An Excel spreadsheet has built-in formulas to calculate the estimated coefficients m and c of a linear regression and the r-squared value. For example, the formula in cell E8 is: =INDEX(LINEST(D4:D8,$E$1:$E$5),2) This formula is calculating coefficient c, which is our constant based on the last five days' data. Cell F8 returns the value of the slope m: =INDEX(LINEST(D4:D8,$E$1:$E$5),1) The formula for cell G8 returns the r-squared: =INDEX(LINEST(D4:D8,$E$1:$E$5,TRUE,TRUE),3) The key is the last value showed in the formula before the final parenthesis, as this instructs the spreadsheet to either return c, m, or r-squared. Once you have the first set of coefficients, you can forecast tomorrow's close. This is performed in cell H9: =E8 +F8*6 Finally, the formula for the forecast oscillator is listed in I9: =(D9-H9)/D9*100 --Editor |
Market index trading on a daily basis.
| Title: | Staff Writer |
| Company: | Technical Analysis, Inc. |
| Address: | 4757 California Ave SW |
| Seattle, WA 98116-4499 | |
| Phone # for sales: | 206 938 0570 |
| Fax: | 206 938 1307 |
| Website: | www.traders.com |
| E-mail address: | dpeterson@traders.com |
Traders' Resource Links | |
| Charting the Stock Market: The Wyckoff Method -- Books | |
| Working-Money.com -- Online Trading Services | |
| Traders.com Advantage -- Online Trading Services | |
| Technical Analysis of Stocks & Commodities -- Publications and Newsletters | |
| Working Money, at Working-Money.com -- Publications and Newsletters | |
| Traders.com Advantage -- Publications and Newsletters | |
| Professional Traders Starter Kit -- Software | |
Click here for more information about our publications!
Comments

|

Request Information From Our Sponsors
- StockCharts.com, Inc.
- Candle Patterns
- Candlestick Charting Explained
- Intermarket Technical Analysis
- John Murphy on Chart Analysis
- John Murphy's Chart Pattern Recognition
- John Murphy's Market Message
- MurphyExplainsMarketAnalysis-Intermarket Analysis
- MurphyExplainsMarketAnalysis-Visual Analysis
- StockCharts.com
- Technical Analysis of the Financial Markets
- The Visual Investor
- VectorVest, Inc.
- Executive Premier Workshop
- One-Day Options Course
- OptionsPro
- Retirement Income Workshop
- Sure-Fire Trading Systems (VectorVest, Inc.)
- Trading as a Business Workshop
- VectorVest 7 EOD
- VectorVest 7 RealTime/IntraDay
- VectorVest AutoTester
- VectorVest Educational Services
- VectorVest OnLine
- VectorVest Options Analyzer
- VectorVest ProGraphics v6.0
- VectorVest ProTrader 7
- VectorVest RealTime Derby Tool
- VectorVest Simulator
- VectorVest Variator
- VectorVest Watchdog
