HOT TOPICS LIST
- MACD
- Fibonacci
- RSI
- Gann
- ADXR
- Stochastics
- Volume
- Triangles
- Futures
- Cycles
- Volatility
- ZIGZAG
- MESA
- Retracement
- Aroon
INDICATORS LIST
LIST OF TOPICS
PRINT THIS ARTICLE
by David Penn
Breaking out above a multimonth downtrend line, the 10-year note successfully tests an old high for support.
Position: N/A
David Penn
Technical Writer for Technical Analysis of STOCKS & COMMODITIES magazine, Working-Money.com, and Traders.com Advantage.
PRINT THIS ARTICLE
REVERSAL
Bonds Bounce
08/21/06 12:49:16 PMby David Penn
Breaking out above a multimonth downtrend line, the 10-year note successfully tests an old high for support.
Position: N/A
| I've been hinting at the possibility of a bottom in bonds since June ("A Bottom And A Bounce In Bonds," June 7, 2006; Traders.com Advantage). The bond market did continue lower below the lows of early summer, taking out the May lows in late June. But the market since those lows in late June has shown nothing but a determination to move higher. |

|
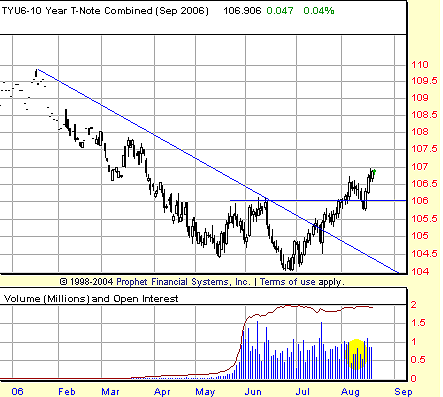
| FIGURE 1: US 10-YEAR TREASURY NOTE, SEPTEMBER FUTURES, DAILY. The September T-note futures break out in the second half of July. Note the decrease in volume during the pullback in early August. |
| Graphic provided by: Prophet Financial, Inc. |
| |
| It is hard not to see the late June lows as a major event in both short (that is, daily) and intermediate (that is, weekly) time frames. This is all the more so as the Treasury note rallies up above the June highs in early August. Whether or not the bear market in bonds ended in June, the market has definitely reversed in the favor of the bulls for the time being, and much of the fuel to power the September T-note higher will likely consist of those who had been profitably short T-notes for weeks and months, finally having to close out or even reverse their positions. |
| We are seeing something very similar in the stock market, as a number of traders remain wedded to the short positions and short-side trading that was so profitable since mid-May. I should point out something else that has happened in the T-note market that is similar to what has taken place in the stock market: the low-volume pullback test of support that took place in early August. Note in Figure 1 how, shortly after breaking out above the June highs, TYU6 began to slip back to the 106 level. As it does so, however, volume is noticeably weaker than it was during the breakout. This sort of declining volume on pullbacks is often a sign of strength—especially when it is resolved by strong volume and a move higher, as was the case on August 15. |

|
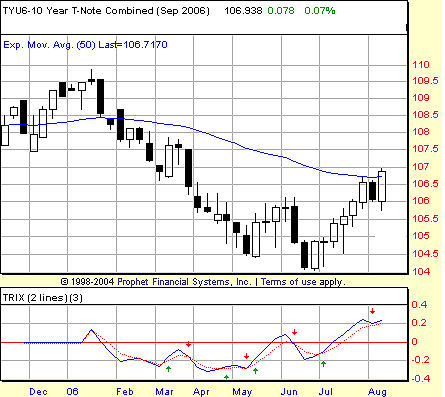
| FIGURE 2: US 10-YEAR TREASURY NOTE, SEPTEMBER FUTURES, WEEKLY. The move higher in bonds is anticipated in this weekly chart by a positive divergence in the TRIX indicator. Note also the breakout above the 106 level. That level is now a potential source of support—even as TYU6 challenges overhead resistance in the form of the 50-week exponential moving average near 106.75. |
| Graphic provided by: Prophet Financial, Inc. |
| |
| The bottom in bonds is all the clearer in the intermediate view shown in Figure 2, although the challenges to continued movement higher are no less clear. First, the bottom. The bottom was telegraphed in the weekly view by the positive divergence in the TRIX, which created a higher low in June relative to May just as the September T-notes themselves were forming lower lows. There was a similar positive divergence to be seen in the weekly stochastic. This divergence alone suggested that the June lows were likely to hold on an intermediate-term basis, with the initial target being the high between the May and June lows at about 106. |
| My suspicion is that bonds might not pull back anytime soon—at least not appreciably. While the daily chart of the September T-note suggests there is room for at least a point's worth of pullback without any significant technical damage being done, the weekly chart makes a move to the 108 level look as likely or more than a retreat below 106. As far as the volume is concerned, TYU6 has already done that as far as a test of the 106 level goes. |
Technical Writer for Technical Analysis of STOCKS & COMMODITIES magazine, Working-Money.com, and Traders.com Advantage.
| Title: | Technical Writer |
| Company: | Technical Analysis, Inc. |
| Address: | 4757 California Avenue SW |
| Seattle, WA 98116 | |
| Phone # for sales: | 206 938 0570 |
| Fax: | 206 938 1307 |
| Website: | www.Traders.com |
| E-mail address: | DPenn@traders.com |
Traders' Resource Links | |
| Charting the Stock Market: The Wyckoff Method -- Books | |
| Working-Money.com -- Online Trading Services | |
| Traders.com Advantage -- Online Trading Services | |
| Technical Analysis of Stocks & Commodities -- Publications and Newsletters | |
| Working Money, at Working-Money.com -- Publications and Newsletters | |
| Traders.com Advantage -- Publications and Newsletters | |
| Professional Traders Starter Kit -- Software | |
Click here for more information about our publications!
Comments
Date: 08/21/06Rank: 2Comment:
Date: 08/22/06Rank: 4Comment:

Request Information From Our Sponsors
- VectorVest, Inc.
- Executive Premier Workshop
- One-Day Options Course
- OptionsPro
- Retirement Income Workshop
- Sure-Fire Trading Systems (VectorVest, Inc.)
- Trading as a Business Workshop
- VectorVest 7 EOD
- VectorVest 7 RealTime/IntraDay
- VectorVest AutoTester
- VectorVest Educational Services
- VectorVest OnLine
- VectorVest Options Analyzer
- VectorVest ProGraphics v6.0
- VectorVest ProTrader 7
- VectorVest RealTime Derby Tool
- VectorVest Simulator
- VectorVest Variator
- VectorVest Watchdog
- StockCharts.com, Inc.
- Candle Patterns
- Candlestick Charting Explained
- Intermarket Technical Analysis
- John Murphy on Chart Analysis
- John Murphy's Chart Pattern Recognition
- John Murphy's Market Message
- MurphyExplainsMarketAnalysis-Intermarket Analysis
- MurphyExplainsMarketAnalysis-Visual Analysis
- StockCharts.com
- Technical Analysis of the Financial Markets
- The Visual Investor
