HOT TOPICS LIST
- MACD
- Fibonacci
- RSI
- Gann
- ADXR
- Stochastics
- Volume
- Triangles
- Futures
- Cycles
- Volatility
- ZIGZAG
- MESA
- Retracement
- Aroon
INDICATORS LIST
LIST OF TOPICS
PRINT THIS ARTICLE
by David Penn
A breakout meanders before gapping higher on the day of options expiration.
Position: N/A
David Penn
Technical Writer for Technical Analysis of STOCKS & COMMODITIES magazine, Working-Money.com, and Traders.com Advantage.
PRINT THIS ARTICLE
HEAD & SHOULDERS
Mr. Softy's Head & Shoulders Bottom
08/18/06 03:45:16 PMby David Penn
A breakout meanders before gapping higher on the day of options expiration.
Position: N/A
| I'd been staring at this head & shoulders bottom for several days, wondering whether to take the bait of one of the more well-developed (and apparently not widely anticipated) bottom formations that I've seen in some time in a major stock (I'll credit the recent Starbucks head & shoulders top for one of the better-formed top patterns). |

|
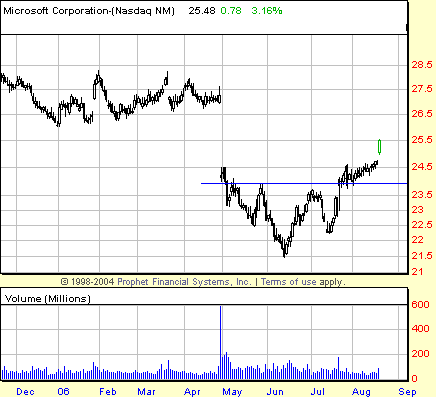
| FIGURE 1: MICROSOFT, DAILY. You won't find too many better-formed, head & shoulders bottoms in a major stock than this one in MSFT. The left shoulder develops over the course of May, the head over the course of June, the right shoulder is completed in July, and the breakout that begins in late July comes into its own in mid-August. |
| Graphic provided by: Prophet Financial, Inc. |
| |
| The volume patterns are not perfect. Generally speaking, a head & shoulders formation should have higher volume early in the pattern and lighter volume late. There is no overwhelming volume trend in the chart here (Figure 1). Arguably, the volume spike on the gap down in earliest May might stand in for the typically outsized volume most often associated with the early stages of a head & shoulders pattern. |
| That aside, however, the pattern is exceptionally well formed. The breakout in late July was muted—one of the factors that kept me away from the trade. Looking at the August calls, I feared there wasn't enough time for MSFT to make it to the strike at 25, particularly given the meager 30-cent ranges that characterized the stock's price movement in the first half of August. And in fact, if it hadn't been for a sudden burst of buying on the day of options expiration, those August 25 calls would have expired worthless. This is as good a time as any to repeat Price Headley's options admonition from his book, Big Trends In Trading: "Buy 1 more month of time than you think you need ... Or Buy 1 strike in from what you think you need." |

|
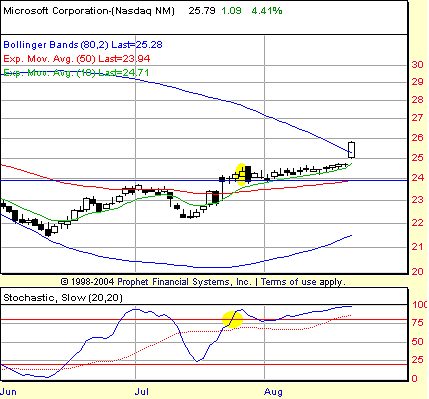
| FIGURE 2: MICROSOFT, DAILY. The BOSO setup is one among many that would have allowed traders to take advantage of the head & shoulders bottom in MSFT by pinpointing a specific entry and stop-loss level. |
| Graphic provided by: Prophet Financial, Inc. |
| |
| One of the tricky things about trading patterns is finding specific entry points. I like to start with a price and volume chart first when looking for patterns, then add one of my favorite set-up screens that will show me good places to make specific entries. One of those screens, the BOSO screen I wrote about in Working-Money.com, is shown in Figure 2. Essentially, it is a stochastic breakout I'm looking for: the stochastic "breaks out" into overbought territory for a long trade. I want to see follow-through in the form of a subsequent session that closes above the high of the breakout session. The close of that follow-through session is my entry. |
| As Figure 2 shows, the stochastic breakout came on July 25 with a high of 24.29. Confirmation came immediately in the form of a close of 24.37 the following day, and I was cleared for takeoff. Again, while the August calls would have been a reasonable play, they would not have left any room for error. Those calls closed on July 26 at 25 cents and traded in a tight range between, roughly, 20 cents and 10 cents until the very day of August expiration, when they were priced as high as 75 cents. |
Technical Writer for Technical Analysis of STOCKS & COMMODITIES magazine, Working-Money.com, and Traders.com Advantage.
| Title: | Technical Writer |
| Company: | Technical Analysis, Inc. |
| Address: | 4757 California Avenue SW |
| Seattle, WA 98116 | |
| Phone # for sales: | 206 938 0570 |
| Fax: | 206 938 1307 |
| Website: | www.Traders.com |
| E-mail address: | DPenn@traders.com |
Traders' Resource Links | |
| Charting the Stock Market: The Wyckoff Method -- Books | |
| Working-Money.com -- Online Trading Services | |
| Traders.com Advantage -- Online Trading Services | |
| Technical Analysis of Stocks & Commodities -- Publications and Newsletters | |
| Working Money, at Working-Money.com -- Publications and Newsletters | |
| Traders.com Advantage -- Publications and Newsletters | |
| Professional Traders Starter Kit -- Software | |
Click here for more information about our publications!
Comments
Date: 08/20/06Rank: 3Comment:

Request Information From Our Sponsors
- StockCharts.com, Inc.
- Candle Patterns
- Candlestick Charting Explained
- Intermarket Technical Analysis
- John Murphy on Chart Analysis
- John Murphy's Chart Pattern Recognition
- John Murphy's Market Message
- MurphyExplainsMarketAnalysis-Intermarket Analysis
- MurphyExplainsMarketAnalysis-Visual Analysis
- StockCharts.com
- Technical Analysis of the Financial Markets
- The Visual Investor
- VectorVest, Inc.
- Executive Premier Workshop
- One-Day Options Course
- OptionsPro
- Retirement Income Workshop
- Sure-Fire Trading Systems (VectorVest, Inc.)
- Trading as a Business Workshop
- VectorVest 7 EOD
- VectorVest 7 RealTime/IntraDay
- VectorVest AutoTester
- VectorVest Educational Services
- VectorVest OnLine
- VectorVest Options Analyzer
- VectorVest ProGraphics v6.0
- VectorVest ProTrader 7
- VectorVest RealTime Derby Tool
- VectorVest Simulator
- VectorVest Variator
- VectorVest Watchdog
