HOT TOPICS LIST
- MACD
- Fibonacci
- RSI
- Gann
- ADXR
- Stochastics
- Volume
- Triangles
- Futures
- Cycles
- Volatility
- ZIGZAG
- MESA
- Retracement
- Aroon
INDICATORS LIST
LIST OF TOPICS
PRINT THIS ARTICLE
by Gary Grosschadl
After peaking in 2005 near $60, EBAY slid to $23. Now it's attempting to come off a multiyear low.
Position: Buy
Gary Grosschadl
Independent Canadian equities trader and technical analyst based in Peterborough
Ontario, Canada.
PRINT THIS ARTICLE
REVERSAL
eBay Coming Off Three-Year Low
08/21/06 07:49:58 AMby Gary Grosschadl
After peaking in 2005 near $60, EBAY slid to $23. Now it's attempting to come off a multiyear low.
Position: Buy
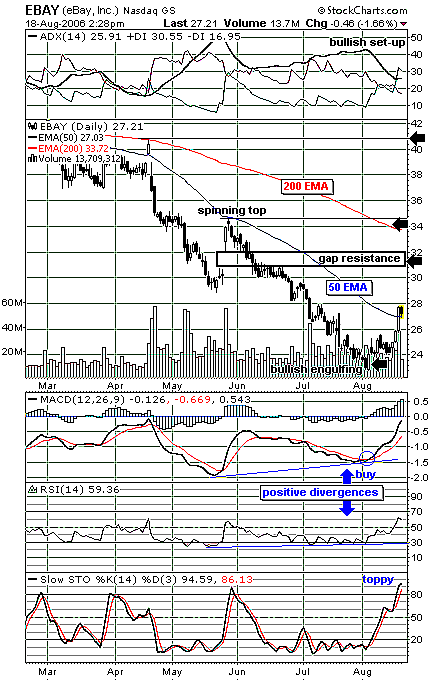
| Note how last May eBay (EBAY) attempted an upleg but was halted at the 50-day exponential moving average (EMA). The spinning top candlestick indicated this bear rally had ended. Now a reliable reversal pattern has launched EBAY into another upleg. After a sizable decline, a bullish engulfing candlestick pattern often heralds a reversal pattern. |
| The directional movement index (DMI) is showing a bullish stance at the top of the chart. The ideal setup for this indicator often occurs with the average directional movement index (ADX) upsloping above 25 (currently 25.91) and the directional index (DI) in a bullish mode with +DI (bullish power) above -DI (bearish power). |

|
| FIGURE 1: EBAY, DAILY. This chart shows reversal attempt for eBay. |
| Graphic provided by: StockCharts.com. |
| |
| See in Figure 1 that the moving average convergence/divergence (MACD) has crossed over, giving a buy signal. Meanwhile, the relative strength index (RSI) has bullishly risen above its often key area of 50. The only worrisome indication is given by the stochastic oscillator, which is now in overbought territory. A move below the 80 level could signal a coming downleg or consolidation. |
| Should EBAY hold above the 50-day EMA, several upside targets are indicated. There is previous gap resistance below $32 and then likely stiff resistance near $34. Here, we find the ever-important 200-day EMA and a previous congestion area near $34 (lining up with the spinning top). Should the bulls run strong, then the $40 area could come into play. This may take some time, as reversals and consolidations could be anticipated. |
Independent Canadian equities trader and technical analyst based in Peterborough
Ontario, Canada.
| Website: | www.whatsonsale.ca/financial.html |
| E-mail address: | gwg7@sympatico.ca |
Click here for more information about our publications!
Comments
Date: 08/21/06Rank: 5Comment:
Date: 08/22/06Rank: 4Comment:

Request Information From Our Sponsors
- VectorVest, Inc.
- Executive Premier Workshop
- One-Day Options Course
- OptionsPro
- Retirement Income Workshop
- Sure-Fire Trading Systems (VectorVest, Inc.)
- Trading as a Business Workshop
- VectorVest 7 EOD
- VectorVest 7 RealTime/IntraDay
- VectorVest AutoTester
- VectorVest Educational Services
- VectorVest OnLine
- VectorVest Options Analyzer
- VectorVest ProGraphics v6.0
- VectorVest ProTrader 7
- VectorVest RealTime Derby Tool
- VectorVest Simulator
- VectorVest Variator
- VectorVest Watchdog
- StockCharts.com, Inc.
- Candle Patterns
- Candlestick Charting Explained
- Intermarket Technical Analysis
- John Murphy on Chart Analysis
- John Murphy's Chart Pattern Recognition
- John Murphy's Market Message
- MurphyExplainsMarketAnalysis-Intermarket Analysis
- MurphyExplainsMarketAnalysis-Visual Analysis
- StockCharts.com
- Technical Analysis of the Financial Markets
- The Visual Investor
