HOT TOPICS LIST
- MACD
- Fibonacci
- RSI
- Gann
- ADXR
- Stochastics
- Volume
- Triangles
- Futures
- Cycles
- Volatility
- ZIGZAG
- MESA
- Retracement
- Aroon
INDICATORS LIST
LIST OF TOPICS
PRINT THIS ARTICLE
by Gary Grosschadl
After hitting a peak near $88, this stock corrected more than 20% to $68.
Position: Buy
Gary Grosschadl
Independent Canadian equities trader and technical analyst based in Peterborough
Ontario, Canada.
PRINT THIS ARTICLE
CHART ANALYSIS
3M Moving Up
08/18/06 02:00:00 PMby Gary Grosschadl
After hitting a peak near $88, this stock corrected more than 20% to $68.
Position: Buy
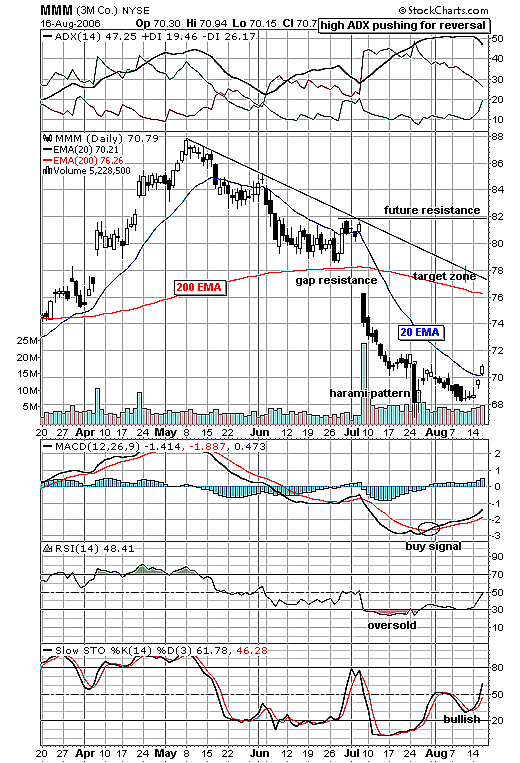
| This daily chart (Figure 1) of 3M illustrates what often happens to stocks in a sizable correction: they slip into failure mode. They have bear rallies that end at or near their 20-day exponential moving average (EMA). |
| Now there are several indications for 3M to have a tradable upside target. Above the chart, the average directional movement index (ADX) is "overheated" and pushing for a reversal of the DIs (directional index). If the green or positive directional index rise above the red or negative directional index, then the bulls gain the upper hand. |

|
| FIGURE 1: MMM. 3M Co. shows some upside promise. |
| Graphic provided by: StockCharts.com. |
| |
| Below the chart, we see several more bullish indicators. The MACD (moving average convergence/divergence) has recently flashed a buy signal from an oversold level. Likewise, the relative strength index (RSI) has also risen above a recent oversold level. Finally, the stochastic oscillator has made a bullish upswing above the often key 50 area. |
| The target zone, should this move hold above the 20 EMA, is $76–78. This zone encompasses triple resistance in the form of gap resistance, 200-day EMA, and trendline resistance. Should a bull thrust continue higher, anticipate resistance at $82. |
Independent Canadian equities trader and technical analyst based in Peterborough
Ontario, Canada.
| Website: | www.whatsonsale.ca/financial.html |
| E-mail address: | gwg7@sympatico.ca |
Click here for more information about our publications!
Comments
Date: 08/20/06Rank: 5Comment:

Request Information From Our Sponsors
- StockCharts.com, Inc.
- Candle Patterns
- Candlestick Charting Explained
- Intermarket Technical Analysis
- John Murphy on Chart Analysis
- John Murphy's Chart Pattern Recognition
- John Murphy's Market Message
- MurphyExplainsMarketAnalysis-Intermarket Analysis
- MurphyExplainsMarketAnalysis-Visual Analysis
- StockCharts.com
- Technical Analysis of the Financial Markets
- The Visual Investor
- VectorVest, Inc.
- Executive Premier Workshop
- One-Day Options Course
- OptionsPro
- Retirement Income Workshop
- Sure-Fire Trading Systems (VectorVest, Inc.)
- Trading as a Business Workshop
- VectorVest 7 EOD
- VectorVest 7 RealTime/IntraDay
- VectorVest AutoTester
- VectorVest Educational Services
- VectorVest OnLine
- VectorVest Options Analyzer
- VectorVest ProGraphics v6.0
- VectorVest ProTrader 7
- VectorVest RealTime Derby Tool
- VectorVest Simulator
- VectorVest Variator
- VectorVest Watchdog
