HOT TOPICS LIST
- MACD
- Fibonacci
- RSI
- Gann
- ADXR
- Stochastics
- Volume
- Triangles
- Futures
- Cycles
- Volatility
- ZIGZAG
- MESA
- Retracement
- Aroon
INDICATORS LIST
LIST OF TOPICS
PRINT THIS ARTICLE
by Paolo Pezzutti
News about Dell's battery recall and the company's second-quarter earnings release have occurred in a technically interesting situation, where the stock has printed a pivot low and developed a short-term reversal formation. However, an ongoing informal inquiry about accounting practices may have a negative effect on the technical developments.
Position: N/A
Paolo Pezzutti
Author of the book "Trading the US Markets - A Comprehensive Guide to US Markets for International Traders and Investors" - Harriman House (July 2008)
PRINT THIS ARTICLE
TECHNICAL ANALYSIS
Adam And Eve Pattern For DELL
08/18/06 02:06:46 PMby Paolo Pezzutti
News about Dell's battery recall and the company's second-quarter earnings release have occurred in a technically interesting situation, where the stock has printed a pivot low and developed a short-term reversal formation. However, an ongoing informal inquiry about accounting practices may have a negative effect on the technical developments.
Position: N/A
| On August 14, Dell (DELL) announced the voluntary recall of approximately 4.1 million Dell-branded lithium-ion batteries with cells manufactured by Sony. The company said that under rare conditions, these batteries could possibly overheat, risking fire. The event is considered generally as a negative sign about the brand, but this is not a given. The product failure is a moment of truth for the company. A poorly managed response would be very negative. However, a well-managed product recall could demonstrate a company's regard for its customers. On August 17, Dell released second-quarter, fiscal-year 2007 earnings. The company reported a second-quarter profit that fell almost 50% from a year ago. In addition, the company said that for the first time it will sell desktop personal computers that use microprocessors from Advanced Micro Devices. Afterward, Dell lost more than 5% to trade at $21.55 in the afterhours. The company said that it has been cooperating with the Securities and Exchange Commission (SEC) on an informal investigation of its accounting practices, including how the company booked its revenue, in past years. This fact might have had a heavy influence on the next day's price action. |

|
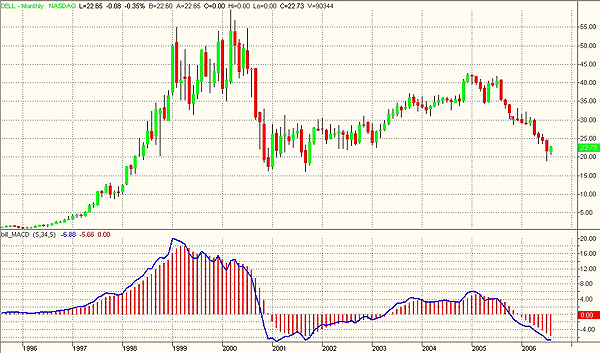
| FIGURE 1: DELL, MONTHLY. The stock is still below about 50% from the 2000 top. |
| Graphic provided by: TradeStation. |
| |
| Technically, Dell has been in a downtrend since the beginning of 2005. In Figure 1 you can see the monthly chart. After the March 2000 above $59, the stock plunged to reach a low at about $16 in December 2000. Prices managed to recover the $40 value only at the end of 2004. The steep downtrend that began in 2005 is still ongoing. |

|
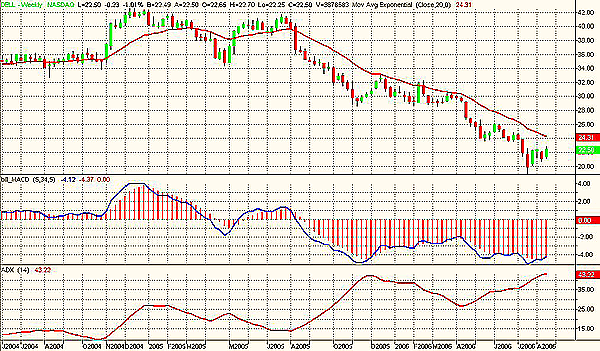
| FIGURE 2: DELL, WEEKLY. The downtrend initiated at the beginning of 2005, in this time frame, is still ongoing. The ADX at the level of 43 indicates that the trend is strong. |
| Graphic provided by: TradeStation. |
| |
| In the weekly chart in Figure 2, you can see how the ongoing downtrend developed with few corrections at a fast pace. The average directional movement index (ADX) in this time frame is currently at the value of 43, confirming the strength of the trend. The ADX, in fact, measures the trend quality of a security, independent of direction; the greater the ADX value, the stronger a security is trending. Traditionally, values above 30 are assumed to indicate an ongoing trend. |

|
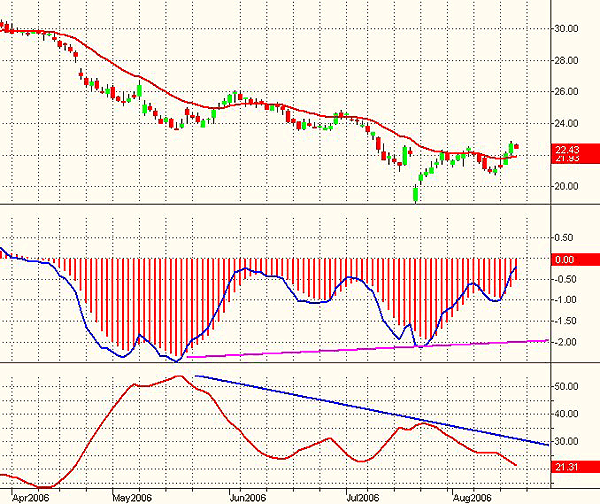
| FIGURE 3: DELL, DAILY. THe ADX at 21 and the positive divergence of MACD indicate the trend conditions have changed in the short term. |
| Graphic provided by: TradeStation. |
| |
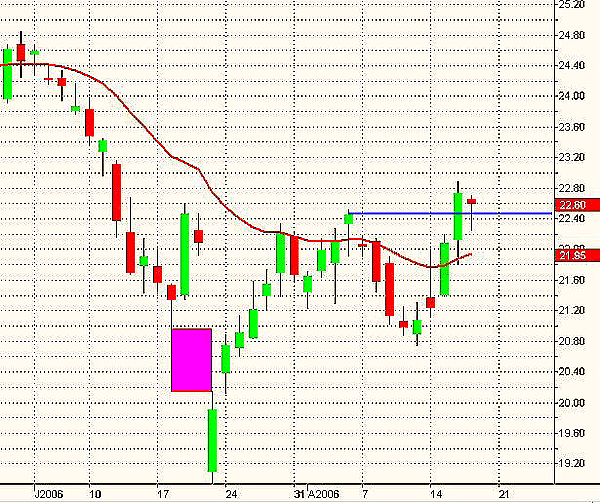
| The most interesting indications come from the daily chart (Figures 3 and 4). In this time frame, you can see that the present value of the ADX is only 21, indicating that the stock might have entered a different phase in the short term. This view is supported also by the positive moving average convergence/divergence (MACD) printed in coincidence with the July 21 low. The low was printed on a big down-gap day. Most important, the peak in volume printed--more than 124 million shares--is about eight times the average volume in that period. It indicates that those who wanted to sell did so that day. Following that trading session, the stock managed to close the gap quickly, printing an Adam and Eve pattern. This short-term formation is characterized by a sharp and deep first bottom on high volume (Adam). The stock bounced and developed a gentler correction, printing a second bottom (Eve) on lower volatility. Eve's rounded bottom takes longer to develop than the Adam spike, and it is characterized by lower volumes. Price action congests into a tight range and the stock then breaks to the upside. The top of Eve marks an excellent entry point when broken. The resistance is often located along the top of the center retracement pivot. The opposite is true when the Adam and Eve formation identifies a top. |

|
| FIGURE 4: DELL, DAILY. The Adam and Eve formation might project prices higher and at least support a longer rebound of the stock. Negative news, however, may have a negative effect on the formation development. |
| Graphic provided by: TradeStation. |
| |
| The Adam bar printed also an exhaustion gap. Eve developed in the form of an a-b-c correction. The relative high was printed on August 4 at $22.52. Prices then retraced to resume the up move and broke out the Eve top on August 16. However, the down gap open expected for the next trading session may jeopardize the formation. Risk must be managed carefully, especially in light of the investigation news, which may affect the next price action. Dell is still in an intermediate-term downtrend. In these conditions, you might conclude that a bottom has been reached, only to discover that it's a breakout to new lows. Stop-loss must be applied with discipline, because the failure of this pattern will gain downside momentum quickly. |
Author of the book "Trading the US Markets - A Comprehensive Guide to US Markets for International Traders and Investors" - Harriman House (July 2008)
| Address: | VIA ROBERTO AGO 26 POSTAL CODE 00166 |
| Rome, ITALY | |
| Phone # for sales: | +393357540708 |
| E-mail address: | pezzutti.paolo@tiscali.it |
Click here for more information about our publications!
Comments
Date: 08/20/06Rank: 4Comment:
Date: 09/03/06Rank: 3Comment:

Request Information From Our Sponsors
- VectorVest, Inc.
- Executive Premier Workshop
- One-Day Options Course
- OptionsPro
- Retirement Income Workshop
- Sure-Fire Trading Systems (VectorVest, Inc.)
- Trading as a Business Workshop
- VectorVest 7 EOD
- VectorVest 7 RealTime/IntraDay
- VectorVest AutoTester
- VectorVest Educational Services
- VectorVest OnLine
- VectorVest Options Analyzer
- VectorVest ProGraphics v6.0
- VectorVest ProTrader 7
- VectorVest RealTime Derby Tool
- VectorVest Simulator
- VectorVest Variator
- VectorVest Watchdog
- StockCharts.com, Inc.
- Candle Patterns
- Candlestick Charting Explained
- Intermarket Technical Analysis
- John Murphy on Chart Analysis
- John Murphy's Chart Pattern Recognition
- John Murphy's Market Message
- MurphyExplainsMarketAnalysis-Intermarket Analysis
- MurphyExplainsMarketAnalysis-Visual Analysis
- StockCharts.com
- Technical Analysis of the Financial Markets
- The Visual Investor
