HOT TOPICS LIST
- MACD
- Fibonacci
- RSI
- Gann
- ADXR
- Stochastics
- Volume
- Triangles
- Futures
- Cycles
- Volatility
- ZIGZAG
- MESA
- Retracement
- Aroon
INDICATORS LIST
LIST OF TOPICS
PRINT THIS ARTICLE
by David Penn
Here's an Elliott wave look at the June bottom in the Standard & Poor's 500.
Position: N/A
David Penn
Technical Writer for Technical Analysis of STOCKS & COMMODITIES magazine, Working-Money.com, and Traders.com Advantage.
PRINT THIS ARTICLE
ELLIOTT WAVE
Summer Waves
08/17/06 07:58:21 AMby David Penn
Here's an Elliott wave look at the June bottom in the Standard & Poor's 500.
Position: N/A
| An advertisement for the Summer Waves Water Park in Jekyll Island, GA, begins: "How many gallons of cool blue water does it take to make a perfect summer day?" Looking at the way the market has behaved since bottoming in mid-June makes me want to ask a question: "How many gallons of bearish sentiment does it take to make a perfect setup for higher prices for stocks?" |

|
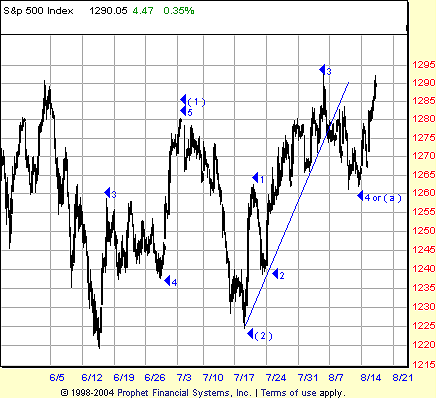
| FIGURE 1: S&P 500, HOURLY. An Elliott wave count of the S&P 500 since the June bottom suggests that the market is deep into a third wave rally that began in mid-July. |
| Graphic provided by: Prophet Financial, Inc. |
| |
| At the risk of engaging in shameless self-promotion, I've been chronicling the vagaries of negative sentiment over the summer both here at Traders.com Advantage as well as at my own blog, moodmovesmarkets. As I noted there, a correction that began—in social mood terms—with the allegations of rape and murder against American soldiers in Iraq has become a correction characterized instead by the 30-odd day war between Israel and Hezbollah forces operating out of South Lebanon. I've suggested repeatedly that this was the sort of social mood stumble that we could expect in an otherwise rising market—pointing out, for example, that Israeli invasions of southern Lebanon have had a slight historical tendency to produce bottoms in the market (see my "Cannons And Trumpets," Traders.com Advantage; July 21, 2006). |
| In other articles for Working-Money.com, I've advanced the argument that the stock market completed a fourth wave low in June, a low that was consonant with intermediate- and short-term cycle lows (according to the work of Tim Wood of cyclesman.com). This means that the third wave high in May should be exceeded by the current rally. As such, I've tried to plot out a wave count that would plot the likely path of such a rally. The first two waves of that path—and the beginnings of the third—are shown in Figure 1. Even this early wave count can provide some clues as to the sort of upside that traders should be prepared for, especially those traders who have become wedded to the notion of selling bounces since the market topped in May. |

|
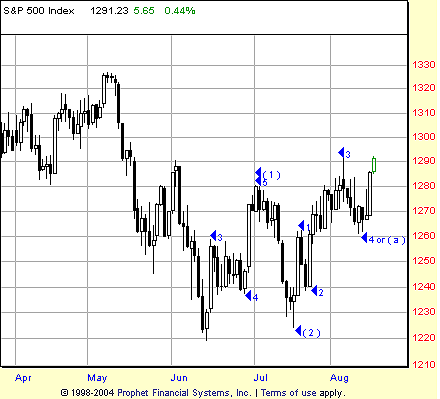
| FIGURE 2: S&P 500, DAILY. If the wave count noted here is accurate, then a test of the May highs is likely before the summer rally in stocks is done. |
| Graphic provided by: Prophet Financial, Inc. |
| |
| I use the Robert Fischer method of wave projection that he introduces in his book Fibonacci Applications And Strategies For Traders. Looking first at wave (3) that began with the mid-July lows, we have a wave 1 from 1225 to 1260, and a wave 3 from 1225 to 1290. That means that wave 1 is approximately 35 points and wave 3 is 65 points. I multiply 35 x 1.618 and 65 x 0.618 to get 57 and 40, respectively. Those products are added to the value at the end of the two waves, so 1260 + 57 for wave 1 and 1290 + 40 for wave 3. This provides for a target range for wave 5—which is also wave (3)—of 1317 to 1377. If we average the two, we can come up with an idealized target of 1324, and a test of the May highs (Figure 2). |
| Again, this would be a target for wave (3), not for what I believe will be the final top of this rally, a wave (5) top that would also be the top of the 2003–06 cyclical bull market. Although it is going even farther out on a limb, we can make the most tentative of guesses as to where such a top might be by taking our previous assumption of a wave (3) top at or near 1324 and doing another Fischer projection. In this instance, we look at wave (1) from mid-June to early July (1220 to 1280 for 60 points) as well as our idealized wave (3) from mid-July to sometime in August (1220 to 1324 for 104 points); 60 x 1.618 = 97 points, which, added to 1280, gives us a low-end projection of 1377; and 104 x 0.618 = 64 points, which, added to 1324, gives us a high-end projection of 1388. Averaging these two values gives us a target top of 1382-1383. And while we're looking into our palantir (the "crystal ball" used by the evil wizard Saruman in The Lord Of The Rings for all you non-Tolkien types), we might note that the market is set up for an intermediate cycle high sometime in the second half of September. If the market makes it through August as this count suggests, then it isn't hard to imagine investors coming "back to school" in September, ready to put money to work. |
Technical Writer for Technical Analysis of STOCKS & COMMODITIES magazine, Working-Money.com, and Traders.com Advantage.
| Title: | Technical Writer |
| Company: | Technical Analysis, Inc. |
| Address: | 4757 California Avenue SW |
| Seattle, WA 98116 | |
| Phone # for sales: | 206 938 0570 |
| Fax: | 206 938 1307 |
| Website: | www.Traders.com |
| E-mail address: | DPenn@traders.com |
Traders' Resource Links | |
| Charting the Stock Market: The Wyckoff Method -- Books | |
| Working-Money.com -- Online Trading Services | |
| Traders.com Advantage -- Online Trading Services | |
| Technical Analysis of Stocks & Commodities -- Publications and Newsletters | |
| Working Money, at Working-Money.com -- Publications and Newsletters | |
| Traders.com Advantage -- Publications and Newsletters | |
| Professional Traders Starter Kit -- Software | |
Click here for more information about our publications!
Comments
Date: 08/20/06Rank: 3Comment:

Request Information From Our Sponsors
- VectorVest, Inc.
- Executive Premier Workshop
- One-Day Options Course
- OptionsPro
- Retirement Income Workshop
- Sure-Fire Trading Systems (VectorVest, Inc.)
- Trading as a Business Workshop
- VectorVest 7 EOD
- VectorVest 7 RealTime/IntraDay
- VectorVest AutoTester
- VectorVest Educational Services
- VectorVest OnLine
- VectorVest Options Analyzer
- VectorVest ProGraphics v6.0
- VectorVest ProTrader 7
- VectorVest RealTime Derby Tool
- VectorVest Simulator
- VectorVest Variator
- VectorVest Watchdog
- StockCharts.com, Inc.
- Candle Patterns
- Candlestick Charting Explained
- Intermarket Technical Analysis
- John Murphy on Chart Analysis
- John Murphy's Chart Pattern Recognition
- John Murphy's Market Message
- MurphyExplainsMarketAnalysis-Intermarket Analysis
- MurphyExplainsMarketAnalysis-Visual Analysis
- StockCharts.com
- Technical Analysis of the Financial Markets
- The Visual Investor
