

HOT TOPICS LIST
- MACD
- Fibonacci
- RSI
- Gann
- ADXR
- Stochastics
- Volume
- Triangles
- Futures
- Cycles
- Volatility
- ZIGZAG
- MESA
- Retracement
- Aroon
INDICATORS LIST
LIST OF TOPICS
PRINT THIS ARTICLE
by Paolo Pezzutti
This well-known indicator can help traders assess the market's conditions.
Position: N/A
Paolo Pezzutti
Author of the book "Trading the US Markets - A Comprehensive Guide to US Markets for International Traders and Investors" - Harriman House (July 2008)
PRINT THIS ARTICLE
ON BALANCE VOLUME
On-Balance Volume Overview
08/15/06 07:52:27 AMby Paolo Pezzutti
This well-known indicator can help traders assess the market's conditions.
Position: N/A
| First presented in Joseph Granville's New Strategy Of Daily Stock Market Timing For Maximum Profits (1976), on-balance volume (OBV) sets up two categories: up volume and down volume. When prices close lower one day than they closed the day before, then the volume is considered down volume and assigned a negative value. When prices close higher than they closed the day before, then the volume of that day is considered up volume and assigned a positive value. OBV is a running total of down volume and up volume. In a healthy trend, the indicator tracks the price action for the most part. When a divergence between price action and OBV occurs, it can be a signal that the market trend is about to change from flat to trending, from up to down. Many market technicians overlay the indicator and the price action in order to analyze divergences between the two. On-balance volume is a well-known indicator nowadays, and it is implemented in all major technical analysis software packages. However, some market participants observe that valid signals occur infrequently with this indicator. In fact, it is said that the on-balance volume has a distinct bias to the upside because of the tendency of the stock market to have volume expanded during up days and contracted during down days. Often, new highs of the on-balance volume precede important downturns with the indicator providing no warning. Signals tend to be more reliable at market bottoms where the OBV often precedes price movement. In addition, if your security closed near its low for the day but still positive, all volume would be assigned to the upside. I have not tested these assumptions. I believe that, as with any other indicator, you cannot base your trading rules exclusively on it. I use it only to get a feel for the market's conditions. |
|
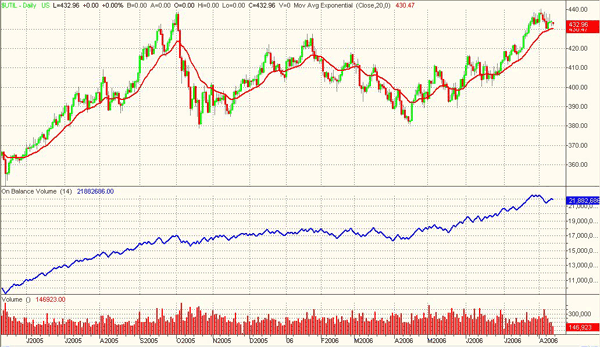
| FIGURE 1: DOW JONES UTILITIES ($UTIL), DAILY. Utilities have been constantly accumulated in the recent past. |
| Graphic provided by: TradeStation. |
| |
| Note in Figure 1 the Dow Jones Utilities ($UTIL). The indicator move more or less at the same pace as prices. When the OBV breaks out to the upside, prices also break out at the same time. This correlation suggests that there is plenty of fuel to continue the rally. It is impressive to see how utilities have been constantly accumulated during the past two years. During corrections, the indicator has not followed prices to the downside at the same pace, but it has demonstrated that traders have continued to accumulate the sectors throughout the period. |
|
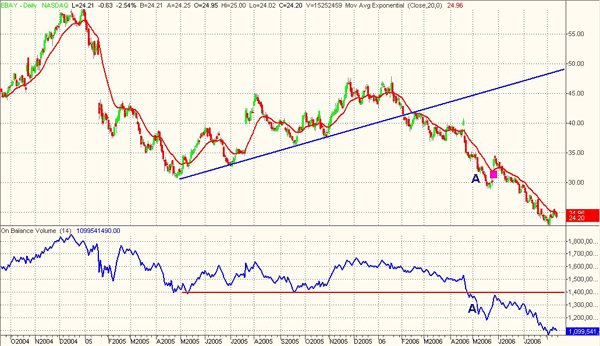
| FIGURE 2: EBAY, DAILY. The stock displays, so far, very weak conditions. Last April, the on-balance volume has anticipated the breakout of prices. |
| Graphic provided by: TradeStation. |
| |
| In Figure 2, eBay (EBAY) displays a different story. After the sharp decline occurred between January and March 2005, the stock developed a long rebound. At the same time, the on-balance volume moved only sideways. In April 2006, the indicator printed new lows, anticipating the price movement. |
|
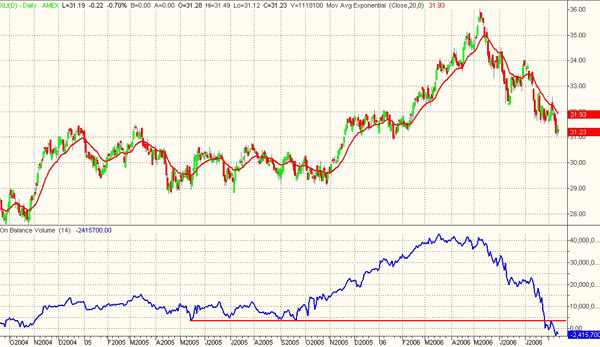
| FIGURE 3: AMEX S&P SELECT INDUSTRIAL SPDR (XLI), DAILY. The indicator has printed new lows. |
| Graphic provided by: TradeStation. |
| |
| In Figure 3, the AMEX S&P Select Industrial SPDR (XLI) displays that during the downtrend initiated last March, the on-balance volume has declined sharply. The indicator has printed new lows, anticipating the price movement and indicating the weakness of the industrial sector. |
|
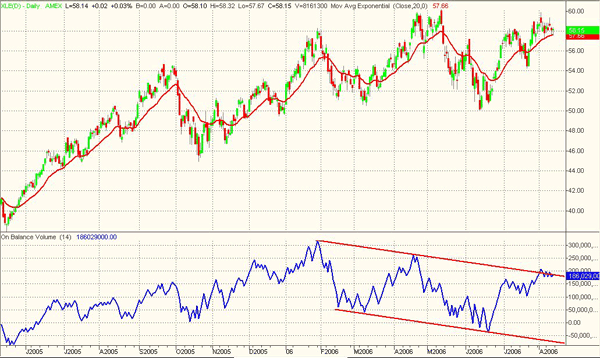
| FIGURE 4: AMEX S&P SELECT ENERGY SPDR (XLE), DAILY. Energy has developed a negative divergence of the OBV indicator with reference to the ongoing price movement. |
| Graphic provided by: TradeStation. |
| |
| In Figure 4, the AMEX S&P Select Energy SPDR (XLE) shows a negative divergence of the OBV indicator with reference to the ongoing price movement. While it is not absolutely said that energy is close to the end of the impressive uptrend printed during the past years, this might be a warning to be taken into account when assessing which sectors the smart money has been going to during the past months. |
Author of the book "Trading the US Markets - A Comprehensive Guide to US Markets for International Traders and Investors" - Harriman House (July 2008)
| Address: | VIA ROBERTO AGO 26 POSTAL CODE 00166 |
| Rome, ITALY | |
| Phone # for sales: | +393357540708 |
| E-mail address: | pezzutti.paolo@tiscali.it |
Click here for more information about our publications!
Comments
Date:�08/15/06Rank:�4Comment:�
Date:�08/16/06Rank:�5Comment:�
Date:�08/16/06Rank:�4Comment:�
Date:�08/19/06Rank:�5Comment:�
Date:�08/30/06Rank:�5Comment:�

Request Information From Our Sponsors
- StockCharts.com, Inc.
- Candle Patterns
- Candlestick Charting Explained
- Intermarket Technical Analysis
- John Murphy on Chart Analysis
- John Murphy's Chart Pattern Recognition
- John Murphy's Market Message
- MurphyExplainsMarketAnalysis-Intermarket Analysis
- MurphyExplainsMarketAnalysis-Visual Analysis
- StockCharts.com
- Technical Analysis of the Financial Markets
- The Visual Investor
- VectorVest, Inc.
- Executive Premier Workshop
- One-Day Options Course
- OptionsPro
- Retirement Income Workshop
- Sure-Fire Trading Systems (VectorVest, Inc.)
- Trading as a Business Workshop
- VectorVest 7 EOD
- VectorVest 7 RealTime/IntraDay
- VectorVest AutoTester
- VectorVest Educational Services
- VectorVest OnLine
- VectorVest Options Analyzer
- VectorVest ProGraphics v6.0
- VectorVest ProTrader 7
- VectorVest RealTime Derby Tool
- VectorVest Simulator
- VectorVest Variator
- VectorVest Watchdog