HOT TOPICS LIST
- MACD
- Fibonacci
- RSI
- Gann
- ADXR
- Stochastics
- Volume
- Triangles
- Futures
- Cycles
- Volatility
- ZIGZAG
- MESA
- Retracement
- Aroon
INDICATORS LIST
LIST OF TOPICS
PRINT THIS ARTICLE
by Paolo Pezzutti
This indicator helps traders assess the participation in market moves, identifying market breadth.
Position: N/A
Paolo Pezzutti
Author of the book "Trading the US Markets - A Comprehensive Guide to US Markets for International Traders and Investors" - Harriman House (July 2008)
PRINT THIS ARTICLE
A/D LINE
The Advance-Decline Line: NYSE, AMEX, And NASDAQ
08/14/06 09:56:11 AMby Paolo Pezzutti
This indicator helps traders assess the participation in market moves, identifying market breadth.
Position: N/A
| Advance/decline data can be an indication of demand and supply factors. The term "declines" represents a cumulative total of the number of stocks that have fallen in price compared to their close on the previous trading day. Conversely, "advances" refers to a cumulative total of the number of stocks that have risen in price compared to their close on the previous trading day. "Advances" and "declines" are also called "advancing issues" and "declining issues," respectively. Advances and declines can be used as a measure of market strength or weakness. Thus, in a rising market, you will generally see more advances, whereas in a falling market, you will usually find more declining issues. You can chart the number of advances versus the number of declines, so you can see how strong the current trend really is. Traditionally, this information has been used with NYSE advancing issues and declining issues data to provide a gauge of market activity without regard to price direction, but both the NASDAQ and AMEX stock exchanges also provide this information. The tickers of advancing and declining issues of NYSE, AMEX, and NASDAQ are, respectively: AMEX advancing issues $ADVA |

|
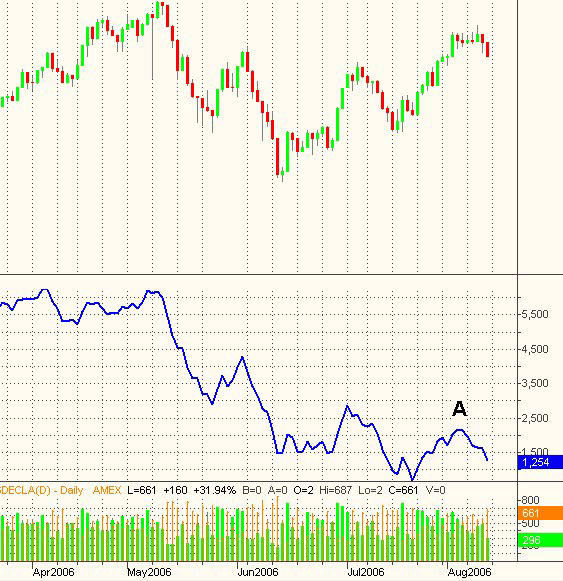
| FIGURE 1: AMEX COMPOSITE INDEX, DAILY. The indicator is printing a negative divergence, not confirming the July relative high of prices. |
| Graphic provided by: TradeStation. |
| |
| The advance-decline line indicator calculates the difference between advancing issues and declining issues and plots the cumulative total of this value for the chart. The difference between advancing issues and declining issues is known as "market breadth." For example, if a stock market index is rallying but there are more issues declining than advancing, then the rally is narrow and much of the stock market is not participating. The formula for calculating the advance-decline issues line is simple: A-D line = Advancing issues - Declining issues or if you want to measure in percent: A-D line = Advancing issues - Declining issues/Total number of Issues A positive A-D line value means more stocks are currently advancing than declining. A negative value represents a situation where more stocks are declining than advancing. This indicator, therefore, can be used when you are trying to assess the market strength and you want to find confirmation of an ongoing trend. Divergences indicate that the ongoing trend is not supported by the majority of the underlying index stocks, which is a sign of weakness. Of course, it cannot be used alone, but it is a useful tool to add to your library of indicators. Based on advancing and declining issues, you can also build other indicators such as the advance/decline ratio, derived from dividing the number of stocks that are currently trading higher (advancing issues) by the number of stocks that are trading lower (declining issues). Other applications are the advance/decline. These principles can be applied not only to the actual number of advancing and declining issues, but also to their respective volume ("advancing volume" and "declining volume"). By applying these indicators to volume data, as opposed to simply the number of stocks moving up or down, you can assess the prevailing market sentiment. |

|
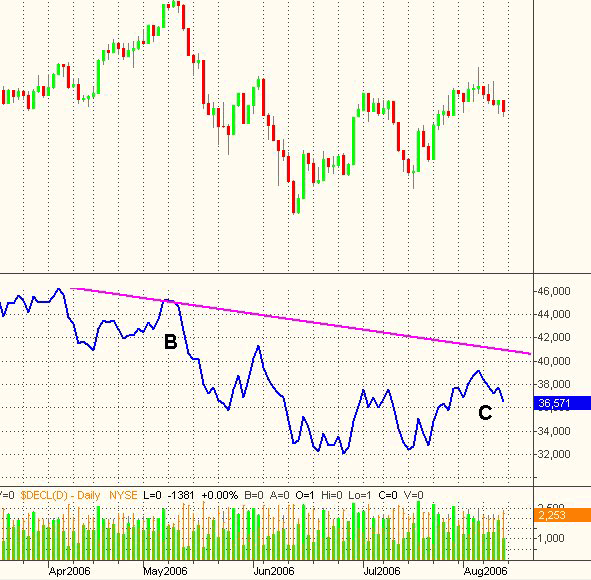
| FIGURE 2: NYSE COMPOSITE INDEX, DAILY. The indicator at point B has printed a negative divergence, anticipating the beginning of the May downtrend. Now, it is moving in gear with prices. |
| Graphic provided by: TradeStation. |
| |
| In Figure 1, you can see the AMEX Composite Index. The advance-decline line in August has printed a negative divergence, not confirming the relative top printed on August 9 and indicating the possibility of weakness for this index (point A). |

|
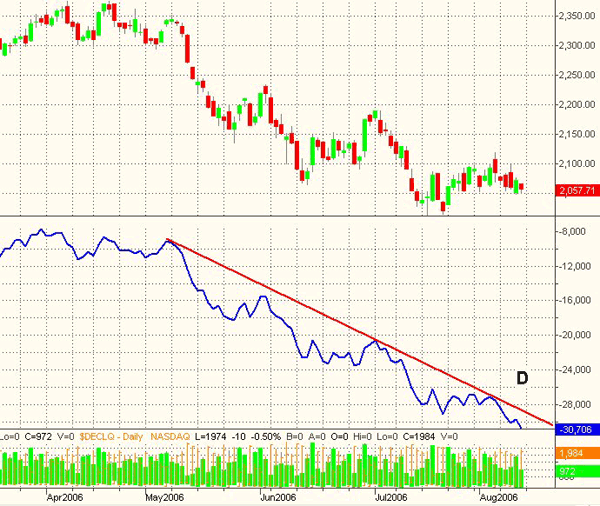
| FIGURE 3: NASDAQ COMPOSITE INDEX. The indicator is printing new lows, anticipating the weakness of prices. |
| Graphic provided by: TradeStation. |
| |
| In Figure 2, the NYSE Composite Index has printed a negative divergence, anticipating the beginning of a downtrend last May (point B). Currently, the indicator at point C is not signaling particular conditions; it is moving together with underlying price changes, although in July it displayed weakness during the rebound. |
| Let's apply this indicator to the NASDAQ Composite Index in Figure 3. In this case, the indicator is printing a new low, indicating the trend weakness of the index (point D). The rebound has not involved most of the stocks and prices are likely to retest previous lows. |
Author of the book "Trading the US Markets - A Comprehensive Guide to US Markets for International Traders and Investors" - Harriman House (July 2008)
| Address: | VIA ROBERTO AGO 26 POSTAL CODE 00166 |
| Rome, ITALY | |
| Phone # for sales: | +393357540708 |
| E-mail address: | pezzutti.paolo@tiscali.it |
Click here for more information about our publications!
Comments
Date: 08/16/06Rank: 5Comment:

Request Information From Our Sponsors
- StockCharts.com, Inc.
- Candle Patterns
- Candlestick Charting Explained
- Intermarket Technical Analysis
- John Murphy on Chart Analysis
- John Murphy's Chart Pattern Recognition
- John Murphy's Market Message
- MurphyExplainsMarketAnalysis-Intermarket Analysis
- MurphyExplainsMarketAnalysis-Visual Analysis
- StockCharts.com
- Technical Analysis of the Financial Markets
- The Visual Investor
- VectorVest, Inc.
- Executive Premier Workshop
- One-Day Options Course
- OptionsPro
- Retirement Income Workshop
- Sure-Fire Trading Systems (VectorVest, Inc.)
- Trading as a Business Workshop
- VectorVest 7 EOD
- VectorVest 7 RealTime/IntraDay
- VectorVest AutoTester
- VectorVest Educational Services
- VectorVest OnLine
- VectorVest Options Analyzer
- VectorVest ProGraphics v6.0
- VectorVest ProTrader 7
- VectorVest RealTime Derby Tool
- VectorVest Simulator
- VectorVest Variator
- VectorVest Watchdog
