HOT TOPICS LIST
- MACD
- Fibonacci
- RSI
- Gann
- ADXR
- Stochastics
- Volume
- Triangles
- Futures
- Cycles
- Volatility
- ZIGZAG
- MESA
- Retracement
- Aroon
INDICATORS LIST
LIST OF TOPICS
PRINT THIS ARTICLE
by Arthur Hill
With Symantec consolidating over the last seven days, a consolidation breakout would signal a continuation higher.
Position: Accumulate
Arthur Hill
Arthur Hill is currently editor of TDTrader.com, a website specializing in trading strategies, sector/industry specific breadth stats and overall technical analysis. He passed the Society of Technical Analysts (STA London) diploma exam with distinction is a Certified Financial Technician (CFTe). Prior to TD Trader, he was the Chief Technical Analyst for Stockcharts.com and the main contributor to the ChartSchool.
PRINT THIS ARTICLE
FLAGS AND PENNANTS
Symantec Rests Before Its Next Move
08/09/06 08:06:31 AMby Arthur Hill
With Symantec consolidating over the last seven days, a consolidation breakout would signal a continuation higher.
Position: Accumulate
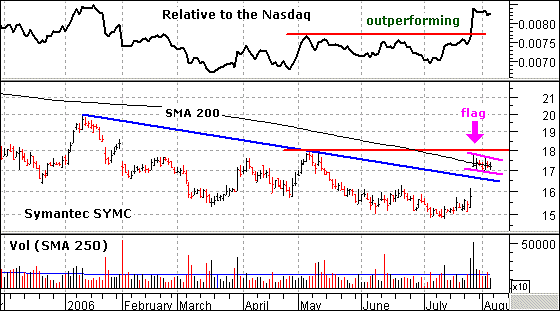
| Symantec surged higher in late July with a gap and high volume. After months of wallowing around the 15-16 level, this gap signals a sudden shift in sentiment and could be the start of a significant trend change. The gap is bullish as long as it holds, but the stock is running into stiff resistance just below 18, and follow-through is required for a more significant trend change. |
| The May high and 200-day moving average mark resistance around the 17-18 level. The stock has traded on either side of the 200-day moving average the last seven days, and this is clearly a battle zone. The May high represents the last reaction high and a move above this level would forge the first higher high in many months. |

|
| FIGURE 1: SYMANTEC. The pattern over the last seven days looks like a flag, and this is a bullish continuation pattern. |
| Graphic provided by: MetaStock. |
| |
| The pattern over the last seven days looks like a flag (Figure 1) and this is a bullish continuation pattern. These patterns represent a rest, and that is exactly what the stock needs after the surge above 17. A break above the upper flag trendline would signal a continuation higher and the upside target would be around 20. Such a move would also break through the 200-day moving average. |
| The price relative has already broken its May high, and this increases the chances for the stock. The price relative compares the performance of SYMC against the NASDAQ. The breakout in late July shows that SYMC is clearly outperforming the NASDAQ, and relative strength is a bullish sign. |
Arthur Hill is currently editor of TDTrader.com, a website specializing in trading strategies, sector/industry specific breadth stats and overall technical analysis. He passed the Society of Technical Analysts (STA London) diploma exam with distinction is a Certified Financial Technician (CFTe). Prior to TD Trader, he was the Chief Technical Analyst for Stockcharts.com and the main contributor to the ChartSchool.
| Title: | Editor |
| Company: | TDTrader.com |
| Address: | Willem Geetsstraat 17 |
| Mechelen, B2800 | |
| Phone # for sales: | 3215345465 |
| Website: | www.tdtrader.com |
| E-mail address: | arthurh@tdtrader.com |
Traders' Resource Links | |
| TDTrader.com has not added any product or service information to TRADERS' RESOURCE. | |
Click here for more information about our publications!
Comments
Date: 08/09/06Rank: 4Comment:

Request Information From Our Sponsors
- StockCharts.com, Inc.
- Candle Patterns
- Candlestick Charting Explained
- Intermarket Technical Analysis
- John Murphy on Chart Analysis
- John Murphy's Chart Pattern Recognition
- John Murphy's Market Message
- MurphyExplainsMarketAnalysis-Intermarket Analysis
- MurphyExplainsMarketAnalysis-Visual Analysis
- StockCharts.com
- Technical Analysis of the Financial Markets
- The Visual Investor
- VectorVest, Inc.
- Executive Premier Workshop
- One-Day Options Course
- OptionsPro
- Retirement Income Workshop
- Sure-Fire Trading Systems (VectorVest, Inc.)
- Trading as a Business Workshop
- VectorVest 7 EOD
- VectorVest 7 RealTime/IntraDay
- VectorVest AutoTester
- VectorVest Educational Services
- VectorVest OnLine
- VectorVest Options Analyzer
- VectorVest ProGraphics v6.0
- VectorVest ProTrader 7
- VectorVest RealTime Derby Tool
- VectorVest Simulator
- VectorVest Variator
- VectorVest Watchdog
