HOT TOPICS LIST
- MACD
- Fibonacci
- RSI
- Gann
- ADXR
- Stochastics
- Volume
- Triangles
- Futures
- Cycles
- Volatility
- ZIGZAG
- MESA
- Retracement
- Aroon
INDICATORS LIST
LIST OF TOPICS
PRINT THIS ARTICLE
by Paolo Pezzutti
During the recent past, the best-performing sectors have been those who benefit from a stable-to-lower interest rates environment, anticipating a change of monetary policy.
Position: N/A
Paolo Pezzutti
Author of the book "Trading the US Markets - A Comprehensive Guide to US Markets for International Traders and Investors" - Harriman House (July 2008)
PRINT THIS ARTICLE
TECHNICAL ANALYSIS
The Fed And The Markets
08/09/06 10:02:14 AMby Paolo Pezzutti
During the recent past, the best-performing sectors have been those who benefit from a stable-to-lower interest rates environment, anticipating a change of monetary policy.
Position: N/A
| After 25 months and 17 straight meetings of quarter-percentage-point increases in benchmark interest rates, the Federal Open Market Committee (FOMC) decided to hold rates steady this past Tuesday, keeping the Fed's fed funds rate at 5.25%. The markets doubt whether the Fed has raised interest rates enough to cool inflationary pressures, or whether they have put growth at risk by raising rates too much. The FOMC kept all its options open. Further tightening would depend on the economic data, because inflation risks remain. At the same time, price pressures seem likely to moderate over time, reflecting the cumulative effects of monetary policy actions and other factors restraining aggregate demand. Economic growth has moderated due to energy costs and the cooling of the housing market. Both views are valid. On one hand, the Fed gives the signal that it is still tightening and just took a break. On the other hand, the Fed appears to believe that the economy will slow, making any more rate hikes unnecessary, even leading to consider cutting rates by the end of the year. Recent economic data showed the US economy slowing. Job growth has been weaker than expected, and the gross domestic product slowed to a 2.5% rate in the second quarter. Slower growth over time will reduce inflation pressures and bring core inflation below the Fed's 2% ceiling. But the economy might be slowing too fast. The delayed impact of the Fed's past 17 rate increases can last up to18 months. The Fed type of language is not what markets would like to hear. Markets expect a clear way ahead to address their capital flows toward the sectors that will take advantage of the new scenario. However, the issue is that we are at a turning point in the monetary policy, but there is a need not to make investors--especially the public--aware of it too early, because it would have a significant impact on markets. It would be better to slowly provide the first signals, displaying some possibilities that the interest rates scenario would change. |

|
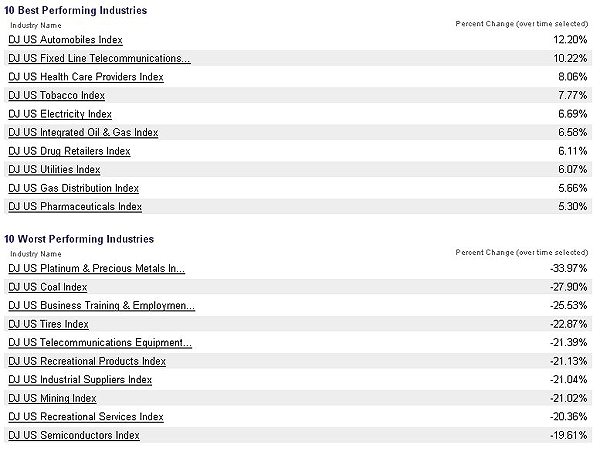
| FIGURE 1: INDUSTRY PERFORMANCE. The best- and the worst-performing industries during the past three months. |
| Graphic provided by: BigCharts.com. |
| |
| The smart money, however, are already leaving the cyclical sectors to move toward sectors that might benefit from the policy change. In Figure 1, you can see the performance of the various industries during the past three months. Among the best performers you can find health care, fixed-lines telecoms, tobacco, electricity, utilities (Figure 2), and pharmaceuticals (Figure 3). This is an important sign of change in the policy for capital flow. The shift will become more evident in the next months when the slowdown of the economies will also affect commodities prices. In my opinion, small caps, technology, and emerging markets present a higher risk. What occurred last May in the emerging markets, in fact, might be a signal of what could happen if the process of reallocation of capitals were too fast. As it is important that markets develop and digest the policy change without crashes or excessive volatility, this is my view on the Fed's behavior. |

|
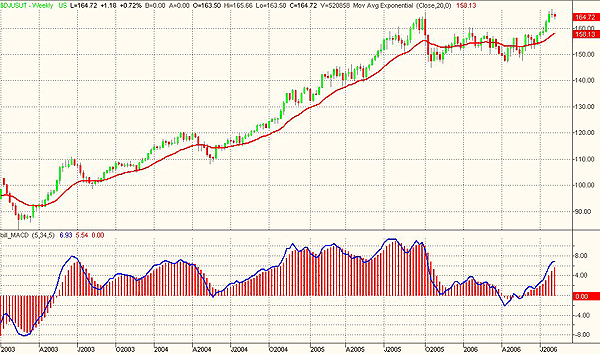
| FIGURE 2: DJ US UTILITIES, WEEKLY. Prices are very close to recent highs. |
| Graphic provided by: TradeStation. |
| |
| As an example of the best-performing sectors during the past three months, I have selected the utilities, the health care, and the telecommunications sectors, but the other sectors are also worth analyzing. In Figure 2, you can see the weekly chart of the DJ US Utilities. Utilities should benefit from a scenario of stable-to-lower interest rates; utilities are close to their highs. Prices are about testing the October 2005 top of 166. In the short term, however, the ongoing correction might bring the index to find a support at lower levels. More accumulation could be needed before a breakout. Momentum, so far, is still low and there is a possibility to see a negative divergence developed. However, I believe that this sector should be accumulated on weakness. |

|
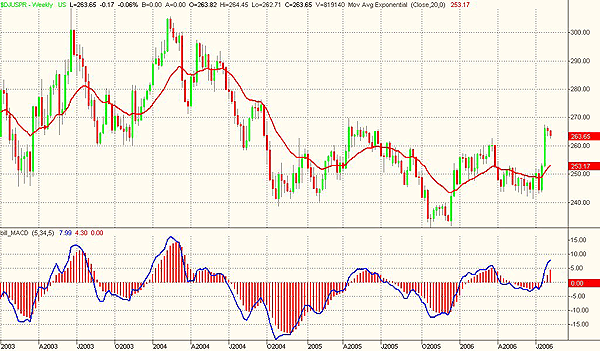
| FIGURE 3: DJ US PHARMACEUTICALS, WEEKLY. An impulse to the upside is indicating that the test of previous resistance levels is likely. |
| Graphic provided by: TradeStation. |
| |
| In Figure 3, you can see the weekly chart of the DJ US Pharmaceuticals. The sector printed a wide-ranging bar last week. This one-day pattern is very significant and printed when volatility exceeds the average volatility of the past number of sessions. This pattern, printed after a long decline, can signal the end of the downtrend. During an established trend, it indicates a further acceleration to set new highs. A wide-ranging day happens when the public enters the market bringing fresh money. It is a strong indication of the future market direction. The high-volatility increase indicates that the market sentiment has shifted from one condition to another, with the public very much involved emotionally in the trading session. The signal is that prices will continue to the upside in the intermediate term, testing the 270 resistance level. A longer-term objective might be the 300 area. |

|
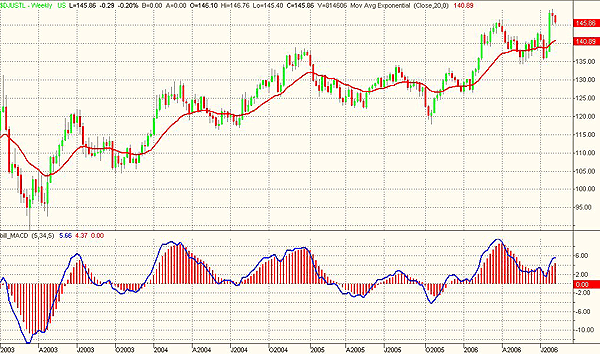
| FIGURE 4: DJ US TELECOMMUNICATIONS, WEEKLY. Prices are close to the recent top, which is the highest level since April 2002. |
| Graphic provided by: TradeStation. |
| |
| In Figure 4, you can see the weekly chart of the DJ US Telecommunications. This sector has recently developed a fast move to the upside, reaching new highs since 2002. The support of 135 for the moment has shown to hold. The sector, in fact, tested last May's relative low with success. The intermediate-term objective might lead to a test of the 160 level. The first support is around the 135 level. Prices are now developing a pullback after the impulse to the upside. In addition, the telecoms printed a wide-ranging bar last week, projecting the index above the 145 resistance. After a short-term consolidation, prices should continue to the upside. It is necessary to spot a low-risk entry point in lower time frames, awaiting a short-term reversal pattern that would resume momentum. |
Author of the book "Trading the US Markets - A Comprehensive Guide to US Markets for International Traders and Investors" - Harriman House (July 2008)
| Address: | VIA ROBERTO AGO 26 POSTAL CODE 00166 |
| Rome, ITALY | |
| Phone # for sales: | +393357540708 |
| E-mail address: | pezzutti.paolo@tiscali.it |
Click here for more information about our publications!
Comments
Date: 08/09/06Rank: 3Comment:
Date: 08/10/06Rank: 4Comment:

Request Information From Our Sponsors
- StockCharts.com, Inc.
- Candle Patterns
- Candlestick Charting Explained
- Intermarket Technical Analysis
- John Murphy on Chart Analysis
- John Murphy's Chart Pattern Recognition
- John Murphy's Market Message
- MurphyExplainsMarketAnalysis-Intermarket Analysis
- MurphyExplainsMarketAnalysis-Visual Analysis
- StockCharts.com
- Technical Analysis of the Financial Markets
- The Visual Investor
- VectorVest, Inc.
- Executive Premier Workshop
- One-Day Options Course
- OptionsPro
- Retirement Income Workshop
- Sure-Fire Trading Systems (VectorVest, Inc.)
- Trading as a Business Workshop
- VectorVest 7 EOD
- VectorVest 7 RealTime/IntraDay
- VectorVest AutoTester
- VectorVest Educational Services
- VectorVest OnLine
- VectorVest Options Analyzer
- VectorVest ProGraphics v6.0
- VectorVest ProTrader 7
- VectorVest RealTime Derby Tool
- VectorVest Simulator
- VectorVest Variator
- VectorVest Watchdog
