HOT TOPICS LIST
- MACD
- Fibonacci
- RSI
- Gann
- ADXR
- Stochastics
- Volume
- Triangles
- Futures
- Cycles
- Volatility
- ZIGZAG
- MESA
- Retracement
- Aroon
INDICATORS LIST
LIST OF TOPICS
PRINT THIS ARTICLE
by David Penn
Failure to follow through to the upside after the August 4th breakout was an ominous sign for S&P bulls.
Position: N/A
David Penn
Technical Writer for Technical Analysis of STOCKS & COMMODITIES magazine, Working-Money.com, and Traders.com Advantage.
PRINT THIS ARTICLE
REVERSAL
A 2B Top Threatens S&P Reversal
08/09/06 08:56:46 AMby David Penn
Failure to follow through to the upside after the August 4th breakout was an ominous sign for S&P bulls.
Position: N/A
| The market is at interesting crossroads. The mid-June lows, with their multiple positive divergences, were a real event, and a number of stocks in a number of sectors have soared in its wake (the financials in particular). Yet the farther we get from the June lows, the less powerful those lows will be in keeping the market from falling. It could be argued that, in the short term, the June lows established a floor of support. Certainly, the fact that the July lows were higher than the June lows is one testament to that. |

|
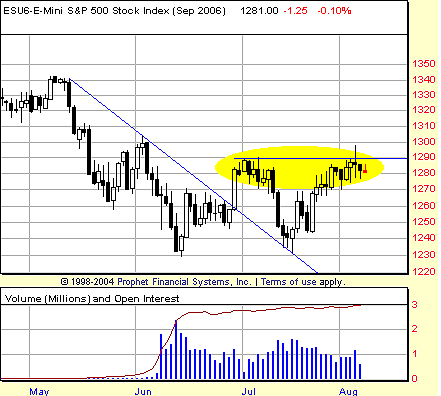
| FIGURE 1: EMINI S&P 500, SEPTEMBER FUTURES. By not following through to the upside after the intraday move above the early July highs, the emini S&P 500 opened the door for a move lower. |
| Graphic provided by: Prophet Financial, Inc. |
| |
| Higher highs and higher lows ... that is the definition of an uptrend and, by that modest definition, the Standard & Poor's 500 has been trending higher since the June bottom. It is no trend to write home about, but to call it anything other than that is to give too much credit to the bears and not enough credit to the bulls. Note that the bears have not been able to close the market at or near session lows since July 21. |
| But the bears could be gaining some hope in the form of the 2B top that appears to have developed between the early July and early August highs (Figure 1). This 2B top has developed in the wake of the inability of the bulls to follow through to the upside after what now appears to be a reversal day on Friday, August 4. In reality, that day was a stalemate: the market fought its way off the lows, couldn't sustain the highs, and wound up somewhere in the middle. In the context of trying to convincingly take out the early July highs, the session could be (and likely was) considered a failure for the long side of the market. Yet in the absence of a breakdown, it is no less a missed opportunity for the bears. |

|
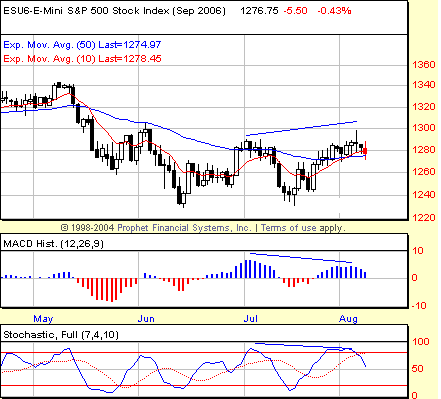
| FIGURE 2: EMINI S&P 500, SEPTEMBER FUTURES. Negative divergences in both the MACD histogram and the stochastic support the bearishness of the 2B top highlighted in Figure 1. |
| Graphic provided by: Prophet Financial, Inc. |
| |
| Considering the negative divergences that are confirming the likelihood of a top in early August, it seems like the most likely resolution of the current setup is for the Standard & Poor's 500--here shown as the September emini S&P futures contract--as a retest of the July lows rather than a complete collapse that takes out both the July and June lows in one horrifying swoon. Such a scenario would set up a three-troughed bottom similar--though on a much smaller scale--to the three-troughed bottom that begat the 2003-06 cyclical bull market. See Figure 2. |
| I can't help but point out again that the markets recently made both intermediate- and shorter-term cycle lows with the June bottom--this according to the cycles work of Tim Wood (cyclesman.com). Not only that, but it appears as if the markets are closing in on the next short-term cycle low in a matter of days. For me, that underscores the possibility that any weakness in the market is more likely to be mild and that the July and June lows will provide a level of support that will prove difficult to break below. |
Technical Writer for Technical Analysis of STOCKS & COMMODITIES magazine, Working-Money.com, and Traders.com Advantage.
| Title: | Technical Writer |
| Company: | Technical Analysis, Inc. |
| Address: | 4757 California Avenue SW |
| Seattle, WA 98116 | |
| Phone # for sales: | 206 938 0570 |
| Fax: | 206 938 1307 |
| Website: | www.Traders.com |
| E-mail address: | DPenn@traders.com |
Traders' Resource Links | |
| Charting the Stock Market: The Wyckoff Method -- Books | |
| Working-Money.com -- Online Trading Services | |
| Traders.com Advantage -- Online Trading Services | |
| Technical Analysis of Stocks & Commodities -- Publications and Newsletters | |
| Working Money, at Working-Money.com -- Publications and Newsletters | |
| Traders.com Advantage -- Publications and Newsletters | |
| Professional Traders Starter Kit -- Software | |
Click here for more information about our publications!
Comments
Date: 08/09/06Rank: 3Comment:
Date: 08/10/06Rank: 5Comment:

Request Information From Our Sponsors
- StockCharts.com, Inc.
- Candle Patterns
- Candlestick Charting Explained
- Intermarket Technical Analysis
- John Murphy on Chart Analysis
- John Murphy's Chart Pattern Recognition
- John Murphy's Market Message
- MurphyExplainsMarketAnalysis-Intermarket Analysis
- MurphyExplainsMarketAnalysis-Visual Analysis
- StockCharts.com
- Technical Analysis of the Financial Markets
- The Visual Investor
- VectorVest, Inc.
- Executive Premier Workshop
- One-Day Options Course
- OptionsPro
- Retirement Income Workshop
- Sure-Fire Trading Systems (VectorVest, Inc.)
- Trading as a Business Workshop
- VectorVest 7 EOD
- VectorVest 7 RealTime/IntraDay
- VectorVest AutoTester
- VectorVest Educational Services
- VectorVest OnLine
- VectorVest Options Analyzer
- VectorVest ProGraphics v6.0
- VectorVest ProTrader 7
- VectorVest RealTime Derby Tool
- VectorVest Simulator
- VectorVest Variator
- VectorVest Watchdog
