HOT TOPICS LIST
- MACD
- Fibonacci
- RSI
- Gann
- ADXR
- Stochastics
- Volume
- Triangles
- Futures
- Cycles
- Volatility
- ZIGZAG
- MESA
- Retracement
- Aroon
INDICATORS LIST
LIST OF TOPICS
PRINT THIS ARTICLE
by David Penn
Breaking out of a six week consolidation pattern, the December 2000 Treasury bond rose three points to a 52-week high just over 101. But a September correction has taken the long bond beneath its short-term moving averages, all but erasing a month's worth of gains.
Position: N/A
David Penn
Technical Writer for Technical Analysis of STOCKS & COMMODITIES magazine, Working-Money.com, and Traders.com Advantage.
PRINT THIS ARTICLE
BOND & INTEREST RATE
Consolidations and Corrections
09/26/00 02:52:01 PMby David Penn
Breaking out of a six week consolidation pattern, the December 2000 Treasury bond rose three points to a 52-week high just over 101. But a September correction has taken the long bond beneath its short-term moving averages, all but erasing a month's worth of gains.
Position: N/A
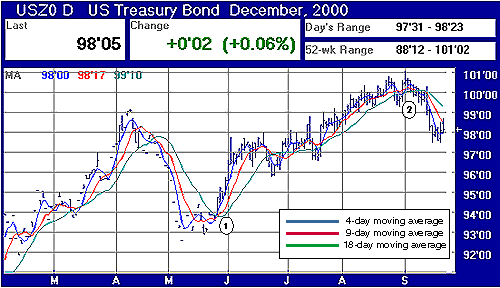
| The 30-year Treasury bond has advanced from its May lows in two major movements. The first climb took the bond from under $94 to a consolidation area between $96 and $98. The consolidation lasted approximately from June to late August, when the second advance began. This second advance, longer lasting and less steep than the late May climb, took the long bond as high as $101 02/32, with another consolidation range forming in August between $99 and $101. |
| But as the August consolidation range extended into September, prices fell dramatically, which may take the 30-year Treasury back into the previous consolidation range between $96 and $98. The declines, however, might well have been anticipated given the relationship between the price trend and its moving averages, as the chart below points out. The December 30-year T-bond fell beneath its 4-, 9- and 18-day moving averages at just about the same time the shorter moving averages began crossing beneath the longer ones--a significantly bearish indication. |

|
| Note the 4-day moving average breaking out over the longer averages at point 1, anticipating the upturn in June. At point 2, the 4-day moving average is crossing under the longer averages, a bearish development. |
| Graphic provided by: Future Source. |
| |
| As the chart reveals, instances in which the shorter, 4-day moving average moved upside the longer, 18-day moving average, coincide with bullish price movements. For example, both the June and mid-July advances are anticipated by the 4-day moving average breaking out over the 9- and 18-day moving averages. Additionally, the 9-day moving average crosses over the 18-day moving average line at almost the same time. Insofar as shorter moving averages reflect more recent price changes, the fact that a moving average with a shorter duration is crossing up over a moving average with a longer duration is considered bullish. |
| However, in September, as the 30-year Treasury is moving into new high territory for the year, we note that the opposite is occurring with respect to the moving averages. Instead of the shorter moving averages crossing over the longer moving averages, we find the 4-day moving average dipping beneath the 9- and 18-day moving averages, leading both price and the other moving averages into the September downturn and into what may become a resumption of the June-August, $96-$98 consolidation range. |
| There is room for a short-term up move in the immediate future, as bond buyers take advantage of the lowest prices in the 30-year Treasury bond since mid-July. And, in fact, there was a small upward reaction developing at the beginning of the last week of September. But given the bond's current placement at the top of its old $96-$98 consolidation range, it is likely to take a great deal of buying and selling pressure to move the bond very significantly in either direction. With little interest rate news on the horizon, and the growth economy continuing to prove its resilience, the 30-year Treasury bond seems quite capable of settling into a "hear no evil" price range in the immediate future. |
Technical Writer for Technical Analysis of STOCKS & COMMODITIES magazine, Working-Money.com, and Traders.com Advantage.
| Title: | Technical Writer |
| Company: | Technical Analysis, Inc. |
| Address: | 4757 California Avenue SW |
| Seattle, WA 98116 | |
| Phone # for sales: | 206 938 0570 |
| Fax: | 206 938 1307 |
| Website: | www.Traders.com |
| E-mail address: | DPenn@traders.com |
Traders' Resource Links | |
| Charting the Stock Market: The Wyckoff Method -- Books | |
| Working-Money.com -- Online Trading Services | |
| Traders.com Advantage -- Online Trading Services | |
| Technical Analysis of Stocks & Commodities -- Publications and Newsletters | |
| Working Money, at Working-Money.com -- Publications and Newsletters | |
| Traders.com Advantage -- Publications and Newsletters | |
| Professional Traders Starter Kit -- Software | |
Click here for more information about our publications!
Comments
Date: / /Rank: Comment: I would like to have the possibility to print the article only without all advertising around the text.
Thanks

|

Request Information From Our Sponsors
- VectorVest, Inc.
- Executive Premier Workshop
- One-Day Options Course
- OptionsPro
- Retirement Income Workshop
- Sure-Fire Trading Systems (VectorVest, Inc.)
- Trading as a Business Workshop
- VectorVest 7 EOD
- VectorVest 7 RealTime/IntraDay
- VectorVest AutoTester
- VectorVest Educational Services
- VectorVest OnLine
- VectorVest Options Analyzer
- VectorVest ProGraphics v6.0
- VectorVest ProTrader 7
- VectorVest RealTime Derby Tool
- VectorVest Simulator
- VectorVest Variator
- VectorVest Watchdog
- StockCharts.com, Inc.
- Candle Patterns
- Candlestick Charting Explained
- Intermarket Technical Analysis
- John Murphy on Chart Analysis
- John Murphy's Chart Pattern Recognition
- John Murphy's Market Message
- MurphyExplainsMarketAnalysis-Intermarket Analysis
- MurphyExplainsMarketAnalysis-Visual Analysis
- StockCharts.com
- Technical Analysis of the Financial Markets
- The Visual Investor
