HOT TOPICS LIST
- MACD
- Fibonacci
- RSI
- Gann
- ADXR
- Stochastics
- Volume
- Triangles
- Futures
- Cycles
- Volatility
- ZIGZAG
- MESA
- Retracement
- Aroon
INDICATORS LIST
LIST OF TOPICS
PRINT THIS ARTICLE
by Paolo Pezzutti
After reaching historically low levels, prices have started a rebound with the potential to continue into the coming weeks.
Position: Buy
Paolo Pezzutti
Author of the book "Trading the US Markets - A Comprehensive Guide to US Markets for International Traders and Investors" - Harriman House (July 2008)
PRINT THIS ARTICLE
TECHNICAL ANALYSIS
Coffee Rebound Continuation Likely
08/08/06 01:27:19 PMby Paolo Pezzutti
After reaching historically low levels, prices have started a rebound with the potential to continue into the coming weeks.
Position: Buy
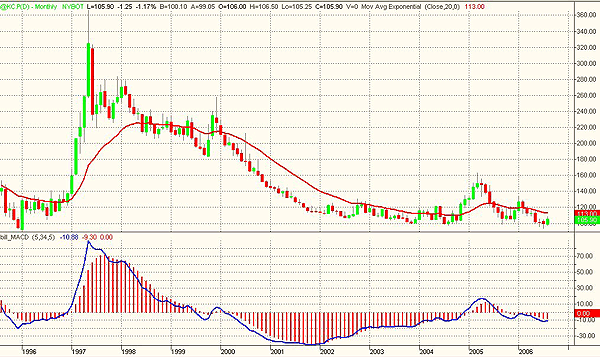
| After the top of May 1997 above $360, coffee started an impressive downtrend that brought prices to a low of $93.95 printed last July, the lowest level since 1996 (Figure 1). The historical low was printed in coincidence with a positive significant moving average convergence/divergence (MACD). Prices did not break out of the important support of $100 and continued the downtrend. This level is important, as it has been touched already three times in the past, in 2003, 2004, and 2005. Prices do not appear to be able to be compressed below this level. |

|
| FIGURE 1: COFFEE, MONTHLY. Prices reached the lowest level since 1996 in coincidence with a significant positive divergence of MACD. The lack of momentum to the downside opens a possibility to start a leg to the upside. |
| Graphic provided by: TradeStation. |
| |
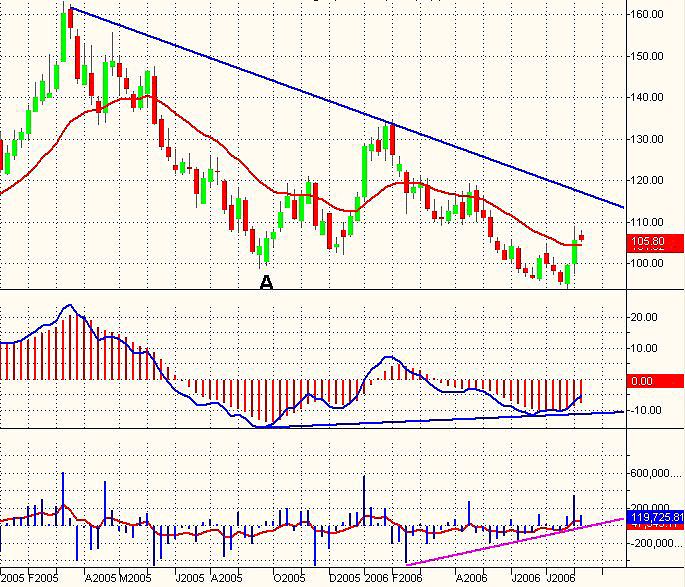
| Figure 2 shows historically low values of the future contract. After the September 2005 low, prices developed an A-B-C move, retracing about 50% of the previous leg of the downtrend. Last July, coffee attempted to breakout the $98.90 low of September 2005 (point A) without success. The bars of the tentative breakout (June 16-23 and July 21) were very short, indicating that low prices were not attracting sellers; there was no follow-through to the down move. After a few sessions, prices entered the previous trading range again. The MACD prints a positive divergence. The force index, an oscillator introduced by Alexander Elder that attempts to measure the force of bulls during uptrends and the force of bears in downtrends, also printed a positive divergence. Its moving average has also entered into positive territory, indicating that the possibility of a positive move in the intermediate term. |

|
| FIGURE 2: COFFEE, WEEKLY. The failure of the breakout and the divergence of the indicators, also in this time frame indicate the chance to see higher prices. |
| Graphic provided by: TradeStation. |
| |
| The force index is an interesting indicator that takes into account price and volume. The force of every move is defined by its direction, distance, and volume. A positive close of prices will print a positive force, and a negative close of prices will print a negative force. The greater the volume, the greater the force, and the greater the price change, the greater the force. The rule for its construction is: Force index = Volume * (close - close of the previous day) The short-term force index is normally smoothed with a two-day exponential moving average (EMA) to help find entry points into the market. A 13-day EMA of the force index helps to track longer-term changes in the force of market's participants. When it is positive, it means that bulls are in control. When it becomes negative, it means the bears have taken control. |

|
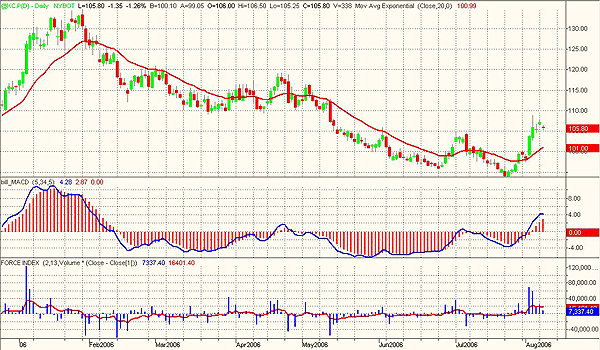
| FIGURE 3: COFFEE, DAILY. The long six-month down move for the moment should be over. Prices are developing a rebound. |
| Graphic provided by: TradeStation. |
| |
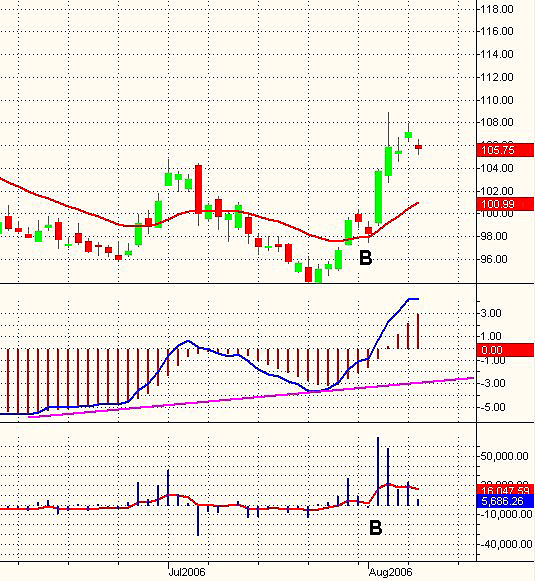
| In the daily time frame (Figure 3), you can see the downtrend that brought prices from above $130 in January 2006 to the $94 of July. Also in this time frame, you can see that the July low occurred in coincidence with a MACD divergence. When you have positive divergences in different time frames, you can spot a low-risk entry point associated to a short-term reversal to get at least a consistent rebound. At point B in Figure 4, the force index printed a negative bar, in coincidence with a two-day correcting move due to profit-taking after a first leg of the up move. Point B is a potential entry point. You place a stop-entry order above the high of the bar. In this case, the trade would have been successful. Prices exploded to the upside exactly on the day of your entry. It is not always like this, but using this methodology it is important to manage risk correctly. The stop loss would be below $97.50. The long up day printed on August 2 indicates the direction of prices in the short term. |

|
| FIGURE 4: COFFEE, DAILY. The point at B indicates the first entry opportunity of the ongoing upleg. Should the force index enter into negative territory, another buy setup would occur to enter the market with a decent risk/reward ratio. |
| Graphic provided by: TradeStation. |
| |
| Prices are now starting a short-term correction. Should the force index enter into negative territory, that would be another buy setup for the next day, placing a buy-stop order above that trading session's high--$110, and following that, $120-135, are intermediate-term objectives. |
Author of the book "Trading the US Markets - A Comprehensive Guide to US Markets for International Traders and Investors" - Harriman House (July 2008)
| Address: | VIA ROBERTO AGO 26 POSTAL CODE 00166 |
| Rome, ITALY | |
| Phone # for sales: | +393357540708 |
| E-mail address: | pezzutti.paolo@tiscali.it |
Click here for more information about our publications!
Comments
Date: 08/09/06Rank: 3Comment:
Date: 08/17/06Rank: Comment: Which country produces the best quality coffee?
Date: 08/23/06Rank: 5Comment: Buongiorno Dott. Pezzutti, sono uno studente della Bocconi di Milano, e da poco ho iniziato a studiare il mercato delle commodities, che per altro trovo davvero interessante. Innanzi tutto complimenti per le sue analisi, che da poco tempo ho iniziato a leggere. Detto ciò avrei bisogno di chiederLe qualche suggerimento su come procedere affinchè lo studio sulle commodities sia efficace; se avesse qualche testo o lettura o del materiale da suggerirmi Le sarei veramente grato.
Ancora complimenti e colgo l occasione per porgerle i miei più sinceri saluti.
Alessandro Raschellà
ciale82@yahoo.it

Request Information From Our Sponsors
- VectorVest, Inc.
- Executive Premier Workshop
- One-Day Options Course
- OptionsPro
- Retirement Income Workshop
- Sure-Fire Trading Systems (VectorVest, Inc.)
- Trading as a Business Workshop
- VectorVest 7 EOD
- VectorVest 7 RealTime/IntraDay
- VectorVest AutoTester
- VectorVest Educational Services
- VectorVest OnLine
- VectorVest Options Analyzer
- VectorVest ProGraphics v6.0
- VectorVest ProTrader 7
- VectorVest RealTime Derby Tool
- VectorVest Simulator
- VectorVest Variator
- VectorVest Watchdog
- StockCharts.com, Inc.
- Candle Patterns
- Candlestick Charting Explained
- Intermarket Technical Analysis
- John Murphy on Chart Analysis
- John Murphy's Chart Pattern Recognition
- John Murphy's Market Message
- MurphyExplainsMarketAnalysis-Intermarket Analysis
- MurphyExplainsMarketAnalysis-Visual Analysis
- StockCharts.com
- Technical Analysis of the Financial Markets
- The Visual Investor
