HOT TOPICS LIST
- MACD
- Fibonacci
- RSI
- Gann
- ADXR
- Stochastics
- Volume
- Triangles
- Futures
- Cycles
- Volatility
- ZIGZAG
- MESA
- Retracement
- Aroon
INDICATORS LIST
LIST OF TOPICS
PRINT THIS ARTICLE
by David Penn
A 1-2-3 trend reversal setup in Comverse Technology sets up the potential for another rising stock in the telecom sector.
Position: N/A
David Penn
Technical Writer for Technical Analysis of STOCKS & COMMODITIES magazine, Working-Money.com, and Traders.com Advantage.
PRINT THIS ARTICLE
REVERSAL
About That Telecom Turnaround
08/07/06 02:43:17 PMby David Penn
A 1-2-3 trend reversal setup in Comverse Technology sets up the potential for another rising stock in the telecom sector.
Position: N/A
| I've been on the telecom bandwagon since at least June, when I suggested that the telecommunications sector was one of the places where speculators and investors were likely to find a bull market ("TTT For TTH," Traders.com Advantage; June 16, 2006). At the time, I highlighted stocks such as AT&T and Bell South—both of which are now trading significantly higher than they were then. AT&T was at 27.79 the day that "TTT For TTH" was posted. It is now trading above 30. Bell South was at 36.08 that day. It is now trading above 40. |

|
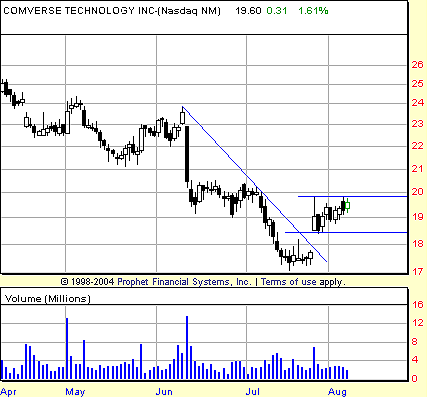
| FIGURE 1: COMVERSE TECHNOLOGY, DAILY. Breaking out above a two-month downtrend line in late July, shares of CMVT find immediate resistance at the July highs. |
| Graphic provided by: Prophet Financial, Inc. |
| |
| Much attention has been focused on telecom companies. But it is also worth looking at some of the smaller companies that provide either equipment or services that make the telecoms go. One of these companies is Comverse Technology (CMVT). CMVT is involved in networking, signaling, and security, and the stock has been in a persistent downtrend since topping in March 2006. |
| Falling from a 2006 peak just north of 29, CMVT lost nearly 40% into the July lows. In late July, shares of CMVT bounced from about 17-1/2 to just above 19 on a noticeable uptick in volume. This move higher helped CMVT break out above a downtrend line that began with the June highs. While the longer-term downtrend (from the March 2006 highs) remains intact, the move above 18 on an increase in volume is another opportunity for CMVT to put in a bottom and, potentially, reverse and move higher. See Figure 1. |

|
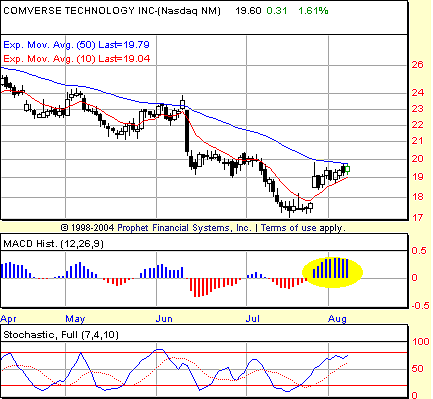
| FIGURE 2: COMVERSE TECHNOLOGY, DAILY. A strongly positive MACD histogram is a sign that CMVT is capable of continuing to move higher. However, it will need to overcome resistance in the form of the 50-day exponential moving average (in blue) in order to do so. |
| Graphic provided by: Prophet Financial, Inc. |
| |
| What are the prospects of CMVT rallying above the July highs? The most immediate threat to such an advance is the declining 50-day exponential moving average (EMA). This moving average has shown itself to be effective resistance to rallies past—blocking upside progress in early June, early May, and early April (not shown). The resistance of the 50-day EMA is further girded by the price action of late June, namely, a short-term consolidation between 19 and 20-1/2. Given the gap up on an increase in volume that occurred in late July, it looks as if a similarly powerful move might be required to boost CMVT up and over the 20 mark. See Figure 2. |
| Figure 1 looks at CMVT through the lens of the 1-2-3 trend reversal, showing that the stock has yet to seriously test the gap it created in late July for support. Although a number of markets have spent the second half of the summer moving in a near-vertical ascent (see my analysis of Zimmer Holdings in "Medicals On The Move," Traders.com Advantage, July 28, 2006), it is perhaps more likely that CMVT, if it is to move higher, will need to do so after either (a) testing the 18-1/2 level and/or (b) moving sideways for a few days while a base is built that will support a more sustainable advance. |
Technical Writer for Technical Analysis of STOCKS & COMMODITIES magazine, Working-Money.com, and Traders.com Advantage.
| Title: | Technical Writer |
| Company: | Technical Analysis, Inc. |
| Address: | 4757 California Avenue SW |
| Seattle, WA 98116 | |
| Phone # for sales: | 206 938 0570 |
| Fax: | 206 938 1307 |
| Website: | www.Traders.com |
| E-mail address: | DPenn@traders.com |
Traders' Resource Links | |
| Charting the Stock Market: The Wyckoff Method -- Books | |
| Working-Money.com -- Online Trading Services | |
| Traders.com Advantage -- Online Trading Services | |
| Technical Analysis of Stocks & Commodities -- Publications and Newsletters | |
| Working Money, at Working-Money.com -- Publications and Newsletters | |
| Traders.com Advantage -- Publications and Newsletters | |
| Professional Traders Starter Kit -- Software | |
Click here for more information about our publications!
Comments
Date: 08/08/06Rank: Comment: JUST SO SO
Date: 08/09/06Rank: 3Comment:

|

Request Information From Our Sponsors
- StockCharts.com, Inc.
- Candle Patterns
- Candlestick Charting Explained
- Intermarket Technical Analysis
- John Murphy on Chart Analysis
- John Murphy's Chart Pattern Recognition
- John Murphy's Market Message
- MurphyExplainsMarketAnalysis-Intermarket Analysis
- MurphyExplainsMarketAnalysis-Visual Analysis
- StockCharts.com
- Technical Analysis of the Financial Markets
- The Visual Investor
- VectorVest, Inc.
- Executive Premier Workshop
- One-Day Options Course
- OptionsPro
- Retirement Income Workshop
- Sure-Fire Trading Systems (VectorVest, Inc.)
- Trading as a Business Workshop
- VectorVest 7 EOD
- VectorVest 7 RealTime/IntraDay
- VectorVest AutoTester
- VectorVest Educational Services
- VectorVest OnLine
- VectorVest Options Analyzer
- VectorVest ProGraphics v6.0
- VectorVest ProTrader 7
- VectorVest RealTime Derby Tool
- VectorVest Simulator
- VectorVest Variator
- VectorVest Watchdog
