HOT TOPICS LIST
- MACD
- Fibonacci
- RSI
- Gann
- ADXR
- Stochastics
- Volume
- Triangles
- Futures
- Cycles
- Volatility
- ZIGZAG
- MESA
- Retracement
- Aroon
INDICATORS LIST
LIST OF TOPICS
PRINT THIS ARTICLE
by Paolo Pezzutti
Rumors about Ford unit Jaguar are moving prices higher.
Position: N/A
Paolo Pezzutti
Author of the book "Trading the US Markets - A Comprehensive Guide to US Markets for International Traders and Investors" - Harriman House (July 2008)
PRINT THIS ARTICLE
TECHNICAL ANALYSIS
Ford: Rebound Likely To Continue
08/07/06 11:53:17 AMby Paolo Pezzutti
Rumors about Ford unit Jaguar are moving prices higher.
Position: N/A
| Ford Motor Co. (F) and Jaguar might be headed for a split. Rumors of an imminent sale increased after the company decided to explore a range of strategic alternatives. Ford has the urgency to fix its financial situation. In addition to that, Ford revised its second-quarter results, stating that Jaguar will lose money in 2006. Even without official announcements, however, speculation is at work. Wall Street believes that closing, selling, or finding an investor in Jaguar would all be options. But whom? European automakers already own notable luxury brands; GM has too many problems of its own and certainly isn't looking to add more brands. Perhaps a Chinese car maker could buy the Jaguar unit or maybe a private investment group. Even if Ford finds a buyer, the benefits of such a sale probably would not last long. On the technical side, however, something might be changing in the intermediate term. |

|
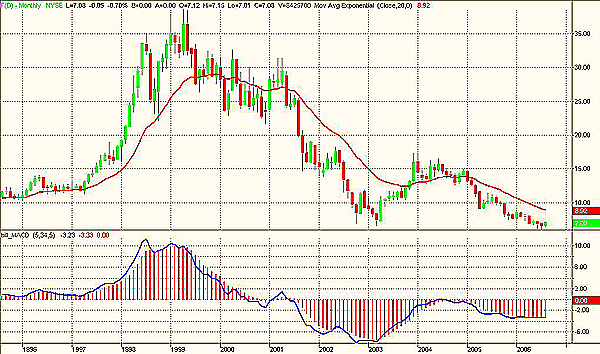
| FIGURE 1: FORD, MONTHLY. The stock has been in a downtrend during the past six years. The MACD has developed a positive divergence in this time frame. |
| Graphic provided by: TradeStation. |
| |
| Those invested in Ford have been hurt badly in the past six years. Prices plunged from the top printed in 1999 at $38.63 to the March 2003 low of $6.58. Prices are now in the $7 area, below the 1994 levels (Figure 1). |

|
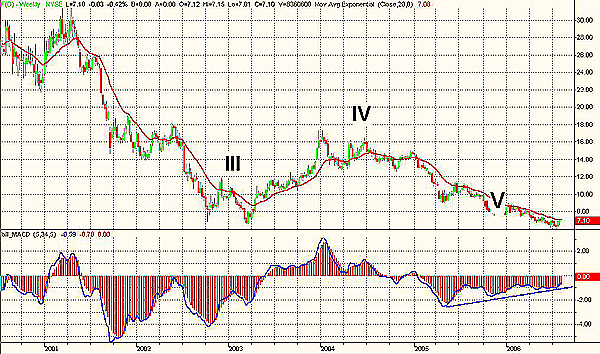
| FIGURE 2: FORD, WEEKLY. The development of wave V has been ongoing since 2004. After two positive divergences of the MACD, the stock has the potential to move higher in the intermediate time frame. |
| Graphic provided by: TradeStation. |
| |
| The interpretation of the ongoing Elliott wave count is displayed in Figure 2 in the weekly time frame. The 2003 low marks the end of wave III. The following move shows how wave IV developed. The moving average convergence/divergence (MACD) (5,34,5) identifies the beginning and the end of this corrective wave, characterized by the fact that the MACD moved up in positive territory. According to this interpretation, Ford has been engaged in wave V since 2004. Wave counting, however, does not provide unique interpretations. Wave V has also developed two extensions to the downside. In fact, in January 2006 a first divergence of MACD was not followed by a significant break to the upside. In the weekly time frame, divergences of the MACD indicator could now support a rebound at least toward the $8 area and then the $9. |

|
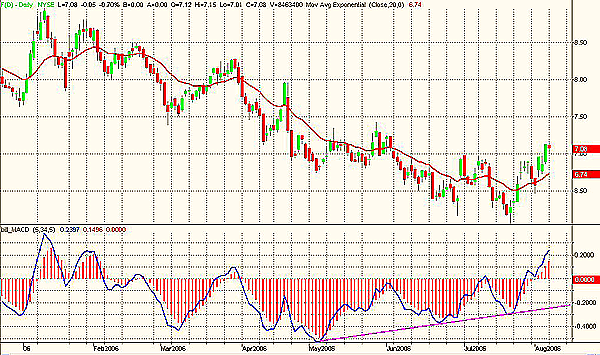
| FIGURE 3: FORD, DAILY. Also in this time frame, two positive divergences confirm the potential for a longer rebound. |
| Graphic provided by: TradeStation. |
| |
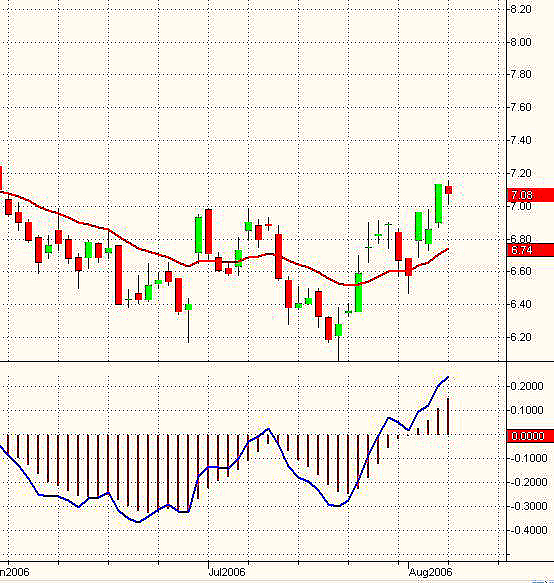
| In the daily time frame (Figures 3 and 4), you can see that Ford printed a low on June 29 in the form of a hammer, typically a potential reversal candle. This pivot was followed on July 23 by a low that turned out to be a failure. Prices again entered promptly within the previous trading range, without having the strength to continue the downtrend. Since that bar, Ford has started a fast move to the upside in coincidence with important divergences of the MACD. Prices could now be close to the first resistance around the $7.20–7.40 level, but something has changed at the technical level for the stock, which should continue its rebound in the next weeks. |

|
| FIGURE 4: FORD, DAILY. On July 23, the stock did not confirm the previous relative low, starting a first leg of the rebound now approaching the first resistance. |
| Graphic provided by: TradeStation. |
| |
| It is very difficult, if not impossible, to predict long-term reversal points. What develops in the short term as a rebound eventually might turn out to be a longer-term pivot point. When you go bottom-fishing, the risk is significantly higher and you might get stopped out more than once before you take the right trade. The important thing, in this case, is to control risk very strictly to limit potential losses. Ford has already developed more than one positive divergence both in the weekly and the daily time frame, without developing, however, a significant price action to the upside and resuming soon the downtrend. This time, the stock seems to have the potential to start at least a consistent rebound. Important short-term supports are at the levels of $6.47 and $6.06. |
Author of the book "Trading the US Markets - A Comprehensive Guide to US Markets for International Traders and Investors" - Harriman House (July 2008)
| Address: | VIA ROBERTO AGO 26 POSTAL CODE 00166 |
| Rome, ITALY | |
| Phone # for sales: | +393357540708 |
| E-mail address: | pezzutti.paolo@tiscali.it |
Click here for more information about our publications!
Comments
Date: 08/09/06Rank: 3Comment:

Request Information From Our Sponsors
- StockCharts.com, Inc.
- Candle Patterns
- Candlestick Charting Explained
- Intermarket Technical Analysis
- John Murphy on Chart Analysis
- John Murphy's Chart Pattern Recognition
- John Murphy's Market Message
- MurphyExplainsMarketAnalysis-Intermarket Analysis
- MurphyExplainsMarketAnalysis-Visual Analysis
- StockCharts.com
- Technical Analysis of the Financial Markets
- The Visual Investor
- VectorVest, Inc.
- Executive Premier Workshop
- One-Day Options Course
- OptionsPro
- Retirement Income Workshop
- Sure-Fire Trading Systems (VectorVest, Inc.)
- Trading as a Business Workshop
- VectorVest 7 EOD
- VectorVest 7 RealTime/IntraDay
- VectorVest AutoTester
- VectorVest Educational Services
- VectorVest OnLine
- VectorVest Options Analyzer
- VectorVest ProGraphics v6.0
- VectorVest ProTrader 7
- VectorVest RealTime Derby Tool
- VectorVest Simulator
- VectorVest Variator
- VectorVest Watchdog
