HOT TOPICS LIST
- MACD
- Fibonacci
- RSI
- Gann
- ADXR
- Stochastics
- Volume
- Triangles
- Futures
- Cycles
- Volatility
- ZIGZAG
- MESA
- Retracement
- Aroon
INDICATORS LIST
LIST OF TOPICS
PRINT THIS ARTICLE
by Koos van der Merwe
Once more in the news, with one analyst shouting SELL and another shouting BUY, what is the correct way to go with Nortel?
Position: Accumulate
Koos van der Merwe
Has been a technical analyst since 1969, and has worked as a futures and options trader with First Financial Futures in Johannesburg, South Africa.
PRINT THIS ARTICLE
DOUBLE BOTTOMS
Nortel Networks Revisited
08/04/06 10:11:39 AMby Koos van der Merwe
Once more in the news, with one analyst shouting SELL and another shouting BUY, what is the correct way to go with Nortel?
Position: Accumulate
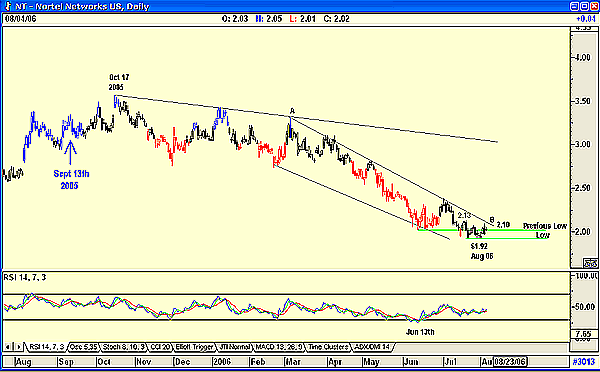
I last reviewed Nortel (NT) on September 13, 2005, and came to the following conclusion:Is Nortel a buy at the present price? The trumpet (widening) formation of the trendlines are telling us to be careful. A widening formation suggests uncertainty, and the maxim "When in doubt, stay out" will apply. My recommendation is therefore to use Nortel for trading, but the risk is there. Keep your stop tight and above all, BE CAREFUL. ... and I was correct. As you can see from Figure 1, Nortel rose until October 17, 2005, and then fell to reach a low of $1.92 by August 2006, in what looks like a falling wedge. |
| What brings Nortel to my attention now? Two things: 1. How much lower can this once-high flyer fall? The company is starting to sell assets to reduce debt, or are they simply selling assets to reduce costs, or getting rid of the lossmakers? At least management is trying to do something positive rather than simply repeat previous flaws in past years' balance sheets. Is the company profitable? Not yet, but then, who knows what is going on in the company. Any fundamental analysis is pure guesswork. |

|
| FIGURE 1: NORTEL NETWORKS. Is it is a buy? Charts are saying, possibly. |
| Graphic provided by: AdvancedGET. |
| |
| 2. Studying the charts shows that something is happening: -The falling wedge. A very powerful correction pattern. Should the price rise and break above the resistance line A-B, then we could see a strong move upward. At the moment, the price to break is $2.10, and with today's price at $1.99, this could happen and soon. -The relative strength index (RSI), which is gradually rising, having given a buy on June 13. -What I call the lower bottom pattern. This is a pattern where the rise since the new low that formed has broken above the previous low. I have always regarded this pattern to be a short-term bullish pattern. -The double bottom that has developed at $1.92. This is a bullish pattern. |
| To conclude, in spite of Nortel's notorious history, its charts are suggesting that the share could be a speculative buy, should it break above $2.10. |
Has been a technical analyst since 1969, and has worked as a futures and options trader with First Financial Futures in Johannesburg, South Africa.
| Address: | 3256 West 24th Ave |
| Vancouver, BC | |
| Phone # for sales: | 6042634214 |
| E-mail address: | petroosp@gmail.com |
Click here for more information about our publications!
Comments
Date: 08/04/06Rank: 2Comment:

Request Information From Our Sponsors
- StockCharts.com, Inc.
- Candle Patterns
- Candlestick Charting Explained
- Intermarket Technical Analysis
- John Murphy on Chart Analysis
- John Murphy's Chart Pattern Recognition
- John Murphy's Market Message
- MurphyExplainsMarketAnalysis-Intermarket Analysis
- MurphyExplainsMarketAnalysis-Visual Analysis
- StockCharts.com
- Technical Analysis of the Financial Markets
- The Visual Investor
- VectorVest, Inc.
- Executive Premier Workshop
- One-Day Options Course
- OptionsPro
- Retirement Income Workshop
- Sure-Fire Trading Systems (VectorVest, Inc.)
- Trading as a Business Workshop
- VectorVest 7 EOD
- VectorVest 7 RealTime/IntraDay
- VectorVest AutoTester
- VectorVest Educational Services
- VectorVest OnLine
- VectorVest Options Analyzer
- VectorVest ProGraphics v6.0
- VectorVest ProTrader 7
- VectorVest RealTime Derby Tool
- VectorVest Simulator
- VectorVest Variator
- VectorVest Watchdog
