

HOT TOPICS LIST
- MACD
- Fibonacci
- RSI
- Gann
- ADXR
- Stochastics
- Volume
- Triangles
- Futures
- Cycles
- Volatility
- ZIGZAG
- MESA
- Retracement
- Aroon
INDICATORS LIST
LIST OF TOPICS
PRINT THIS ARTICLE
by David Penn
Failure to follow through to the downside provides an opportunity for a bounce in OIH.
Position: N/A
David Penn
Technical Writer for Technical Analysis of STOCKS & COMMODITIES magazine, Working-Money.com, and Traders.com Advantage.
PRINT THIS ARTICLE
REVERSAL
A Short-Term 2B Bottom In Oil Service
08/01/06 01:09:03 PMby David Penn
Failure to follow through to the downside provides an opportunity for a bounce in OIH.
Position: N/A
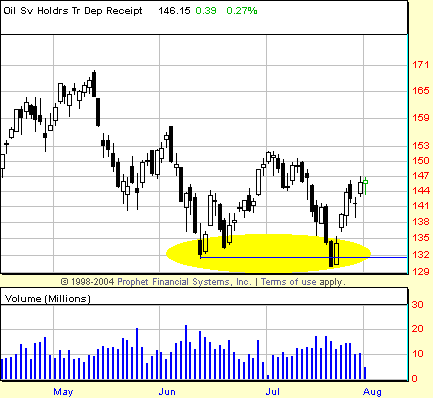
The last sentence of my Traders.com Advantage article "A Head & Shoulders Top In Oil Service?" (July 21, 2006) reads as follows:Confirmation that the previous trend (which was downward) has been reestablished would come if the OIH was able to close below the June lows and show some additional follow-through to the downside (the latter to avoid a potential 2B bounce). |
|
| FIGURE 1: OIL SERVICE HOLDRS, DAILY. Failure to follow through to the downside after support was broken in late July led to a 2B bounce in OIH. Resistance lies between 152 and 150. |
| Graphic provided by: Prophet Financial, Inc. |
| |
| The potential of which I spoke was manifested in the last weeks of July, as failure to follow through to the downside in the wake of the July 21st violation of the June lows has led to a perfect, short-term 2B bounce (Figure 1). This short-term bounce in OIH does not necessarily negate the longer-term head & shoulders pattern that I described a few weeks ago. That pattern has been deprived of its breakdown for the time being. |
| But it is worth remembering that a given market can be bullish in one time frame and bearish in another. In the present, the 2B bottom has clearly stemmed the decline in the oil service stocks. Those who were caught on the short side of the OIH and thinking in a relatively short time frame in all likelihood found themselves covering their positions fairly swiftly when the OIH did not follow through to the downside. Thus, for short-term traders, the downtrend was over. The entry rules for buying a 2B bottom call for an entry just above the high of the session during the initial, higher low was made. In this case, that calls for a buy price of approximately 138—which would have been filled on July 25, a session that closed at 139.46. Three days later, the OIH was trading at 141.60—a nice, three-plus point gain for short-term traders—and five days later, the OIH was trading above 145, an eight-point gain. |
|
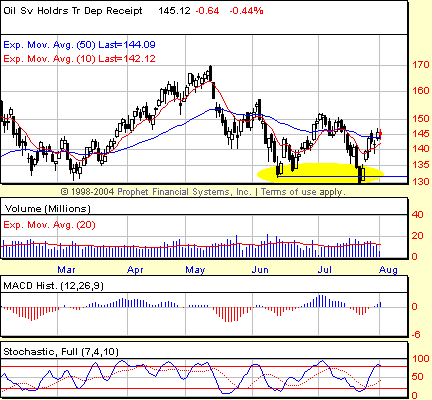
| FIGURE 2: OIL SERVICE HOLDRS, DAILY. Dueling divergences put the relevance of the June lows into question. There are positive divergences between the May and June lows, and between the May and July lows, but the positive divergence between the June and July lows is represented only by the MACD histogram. |
| Graphic provided by: Prophet Financial, Inc. |
| |
| What are the odds that the 2B bottom is marking a more long-lasting low? This possibility is supported by the positive divergence that accompanied the June low (a divergence that was evident in both the stochastic and the MACD histogram). At present, OIH is still making lower closing lows (2B or not 2B, the July low was lower than the June low), so in order for any upside to be worth abiding, that upside will have to set either a higher high by taking out the late June–early July highs just north of 150, or by making a higher low in the event that OIH meets resistance in the 150, and pulls back. See Figure 2. |
| I've made mistakes before when analyzing bottoms and tops that are more than one month apart. Often, when looking for divergences, I'll discount those that involve, for example, an April low and a June low—being biased instead toward May low–June low type of scenarios. It is quite possible that just such a bottom is being created here in the OIH involving the May low and the July low. If this were the case, then the bottom being created would be sizable indeed, and the subsequent bounce no less powerful. Fortunately, speculators and traders don't need to make that call, and can simply rely on the OIH's ability—or lack thereof—to set a new high vis-a-vis the 152 mark last reached on the third of July. |
Technical Writer for Technical Analysis of STOCKS & COMMODITIES magazine, Working-Money.com, and Traders.com Advantage.
| Title: | Technical Writer |
| Company: | Technical Analysis, Inc. |
| Address: | 4757 California Avenue SW |
| Seattle, WA 98116 | |
| Phone # for sales: | 206 938 0570 |
| Fax: | 206 938 1307 |
| Website: | www.Traders.com |
| E-mail address: | DPenn@traders.com |
Traders' Resource Links | |
| Charting the Stock Market: The Wyckoff Method -- Books | |
| Working-Money.com -- Online Trading Services | |
| Traders.com Advantage -- Online Trading Services | |
| Technical Analysis of Stocks & Commodities -- Publications and Newsletters | |
| Working Money, at Working-Money.com -- Publications and Newsletters | |
| Traders.com Advantage -- Publications and Newsletters | |
| Professional Traders Starter Kit -- Software | |
Click here for more information about our publications!
Comments
Date:�08/03/06Rank:�3Comment:�
Date:�08/04/06Rank:�2Comment:�

Request Information From Our Sponsors
- StockCharts.com, Inc.
- Candle Patterns
- Candlestick Charting Explained
- Intermarket Technical Analysis
- John Murphy on Chart Analysis
- John Murphy's Chart Pattern Recognition
- John Murphy's Market Message
- MurphyExplainsMarketAnalysis-Intermarket Analysis
- MurphyExplainsMarketAnalysis-Visual Analysis
- StockCharts.com
- Technical Analysis of the Financial Markets
- The Visual Investor
- VectorVest, Inc.
- Executive Premier Workshop
- One-Day Options Course
- OptionsPro
- Retirement Income Workshop
- Sure-Fire Trading Systems (VectorVest, Inc.)
- Trading as a Business Workshop
- VectorVest 7 EOD
- VectorVest 7 RealTime/IntraDay
- VectorVest AutoTester
- VectorVest Educational Services
- VectorVest OnLine
- VectorVest Options Analyzer
- VectorVest ProGraphics v6.0
- VectorVest ProTrader 7
- VectorVest RealTime Derby Tool
- VectorVest Simulator
- VectorVest Variator
- VectorVest Watchdog