HOT TOPICS LIST
- MACD
- Fibonacci
- RSI
- Gann
- ADXR
- Stochastics
- Volume
- Triangles
- Futures
- Cycles
- Volatility
- ZIGZAG
- MESA
- Retracement
- Aroon
INDICATORS LIST
LIST OF TOPICS
PRINT THIS ARTICLE
by Gary Grosschadl
Having failed brief support at $30, Broadcom dove to $22.50.
Position: Buy
Gary Grosschadl
Independent Canadian equities trader and technical analyst based in Peterborough
Ontario, Canada.
PRINT THIS ARTICLE
REVERSAL
Broadcom Signals A Bottom
07/31/06 09:17:56 AMby Gary Grosschadl
Having failed brief support at $30, Broadcom dove to $22.50.
Position: Buy
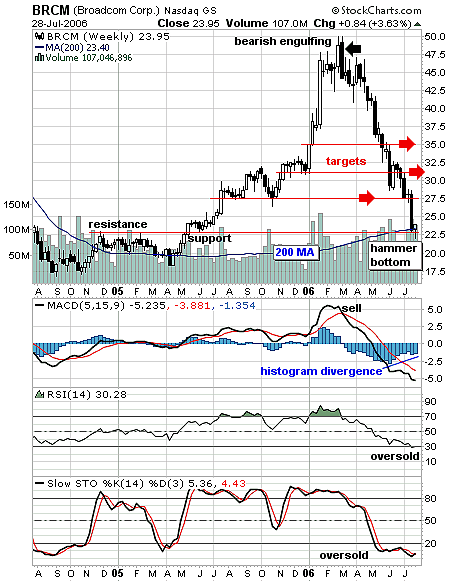
| Figure 1 is a weekly chart of Broadcom, a major supplier of integrated circuits for broadband communications, which aptly shows the principle often quoted when stocks rocket to big gains: "What goes up, must come down." Since peaking at $50, this stock has lost more than half its value in four months. |
| Traders looking for a bounce at $30 were disappointed as the stock resumed its fall. Now, another potential support level is tempting bottom-pickers. A hammer bottom candlestick (with its characteristic long tail) is often a reliable reversal signal. What makes this even more compelling is that this hammer coincides with an important moving average—the 200-period moving average (MA). This area also relates to a former support and resistance level, as shown on the chart. |

|
| FIGURE 1: BRCM, WEEKLY. A bounce is likely on this chart. |
| Graphic provided by: StockCharts.com. |
| |
| The indicators under the chart show oversold conditions. Typically, they will show bullishness only after the initial bounce occurs, as they lag the quicker candlestick reversal patterns. Confirming action from these indicators will show upturns from oversold levels—more specifically, a bullish crossover on the moving average convergence/divergence (MACD) and a move above the 20 level on the stochastic oscillator. Note the early signal from the positive divergence on the MACD's histogram. The histogram plots the difference between the two MACD lines and gives earlier warnings of trend changes. Vertical bars are used to show the difference between the two lines on the chart. |
| Should this reversal manifest, several targets are suggested for profit-taking. These levels of $27.50, $31, and $35 relate to previous levels of support and resistance. |
Independent Canadian equities trader and technical analyst based in Peterborough
Ontario, Canada.
| Website: | www.whatsonsale.ca/financial.html |
| E-mail address: | gwg7@sympatico.ca |
Click here for more information about our publications!
Comments
Date: 08/01/06Rank: 5Comment:
Date: 08/04/06Rank: 5Comment:

Request Information From Our Sponsors
- StockCharts.com, Inc.
- Candle Patterns
- Candlestick Charting Explained
- Intermarket Technical Analysis
- John Murphy on Chart Analysis
- John Murphy's Chart Pattern Recognition
- John Murphy's Market Message
- MurphyExplainsMarketAnalysis-Intermarket Analysis
- MurphyExplainsMarketAnalysis-Visual Analysis
- StockCharts.com
- Technical Analysis of the Financial Markets
- The Visual Investor
- VectorVest, Inc.
- Executive Premier Workshop
- One-Day Options Course
- OptionsPro
- Retirement Income Workshop
- Sure-Fire Trading Systems (VectorVest, Inc.)
- Trading as a Business Workshop
- VectorVest 7 EOD
- VectorVest 7 RealTime/IntraDay
- VectorVest AutoTester
- VectorVest Educational Services
- VectorVest OnLine
- VectorVest Options Analyzer
- VectorVest ProGraphics v6.0
- VectorVest ProTrader 7
- VectorVest RealTime Derby Tool
- VectorVest Simulator
- VectorVest Variator
- VectorVest Watchdog
