HOT TOPICS LIST
- MACD
- Fibonacci
- RSI
- Gann
- ADXR
- Stochastics
- Volume
- Triangles
- Futures
- Cycles
- Volatility
- ZIGZAG
- MESA
- Retracement
- Aroon
INDICATORS LIST
LIST OF TOPICS
PRINT THIS ARTICLE
by Gary Grosschadl
So far in 2006, the Dow Jones Industrial Average has swung up 1,000 points, only to lose it all again. Where is it going now?
Position: Hold
Gary Grosschadl
Independent Canadian equities trader and technical analyst based in Peterborough
Ontario, Canada.
PRINT THIS ARTICLE
CHART ANALYSIS
Trendline Test For The Dow Jones Industrial Average
07/31/06 08:58:42 AMby Gary Grosschadl
So far in 2006, the Dow Jones Industrial Average has swung up 1,000 points, only to lose it all again. Where is it going now?
Position: Hold
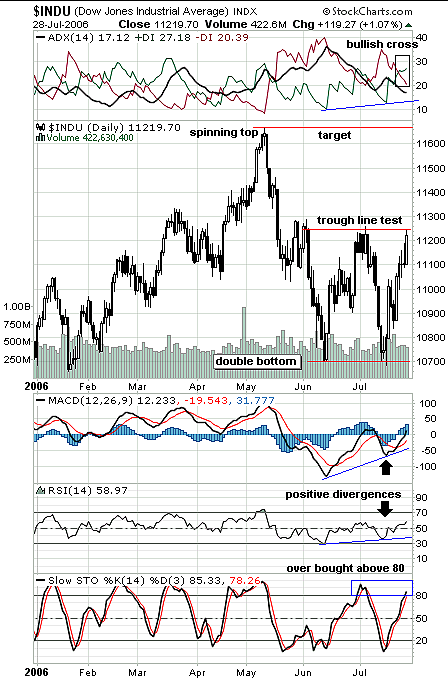
| Figure 1 shows the Dow Jones Industrial Average (DJIA) rising to a high near 11,700 (spinning top candlestick) before coming back down again. The current formation looks like a double bottom test, at least in this abbreviated time frame. |
| The symmetry is good, with a distinct W pattern with a nice horizontal troughline or trendline. Should this pattern act as a double bottom, then it could rise above the troughline an equal distance to the distance below it. This would be a rise of 540 points to just above 11,700, or close to the previous high. |

|
| FIGURE 1: DJIA, DAILY. This daily chart of the Dow Jones Industrial Average (DJIA) shows a trendline test. |
| Graphic provided by: StockCharts.com. |
| |
| Some traders may have anticipated this move off the double bottom, noting several positive divergences. At the top of the chart, the +DI or positive directional movement indicator (green line) shows such a divergence. Note how a bullish cross of the DI lines also hints at the bulls trying to gain momentum. Similar positive divergences to the index's price action can be seen with the moving average convergence/divergence (MACD) and the relative strength index (RSI). |
| The DJIA needs a close above the troughline to instill some confidence that a run to the upside target is likely. Although the MACD and the RSI can be viewed as bullishly poised, the other two indicators are not as hopeful. The directional movement indicator at the top of the chart shows a relatively weak average directional indicator (ADX) currently 17.12. Ideally, good trend strength is reflected with an upsloping ADX line above 20-25. The stochastics oscillator is now reaching an overbought zone above 80. Without good trend strength, this oscillator may endure another downleg versus "sticking" high. Watch for a resolution of the troughline test this trading week. |
Independent Canadian equities trader and technical analyst based in Peterborough
Ontario, Canada.
| Website: | www.whatsonsale.ca/financial.html |
| E-mail address: | gwg7@sympatico.ca |
Click here for more information about our publications!
Comments
Date: 08/01/06Rank: 5Comment:
Date: 08/01/06Rank: 5Comment:
Date: 08/04/06Rank: 5Comment: Very clear detailing of the strengths and weaknesses displayed by the selected technical indicators in combination with the price activity patterns. Can use empirical observation - in this case, backtracking and tracking current price activity - to determine outcomes and the relation of these to the indicators and chart patterns.
Date: 08/04/06Rank: 5Comment:

Request Information From Our Sponsors
- StockCharts.com, Inc.
- Candle Patterns
- Candlestick Charting Explained
- Intermarket Technical Analysis
- John Murphy on Chart Analysis
- John Murphy's Chart Pattern Recognition
- John Murphy's Market Message
- MurphyExplainsMarketAnalysis-Intermarket Analysis
- MurphyExplainsMarketAnalysis-Visual Analysis
- StockCharts.com
- Technical Analysis of the Financial Markets
- The Visual Investor
- VectorVest, Inc.
- Executive Premier Workshop
- One-Day Options Course
- OptionsPro
- Retirement Income Workshop
- Sure-Fire Trading Systems (VectorVest, Inc.)
- Trading as a Business Workshop
- VectorVest 7 EOD
- VectorVest 7 RealTime/IntraDay
- VectorVest AutoTester
- VectorVest Educational Services
- VectorVest OnLine
- VectorVest Options Analyzer
- VectorVest ProGraphics v6.0
- VectorVest ProTrader 7
- VectorVest RealTime Derby Tool
- VectorVest Simulator
- VectorVest Variator
- VectorVest Watchdog
