HOT TOPICS LIST
- MACD
- Fibonacci
- RSI
- Gann
- ADXR
- Stochastics
- Volume
- Triangles
- Futures
- Cycles
- Volatility
- ZIGZAG
- MESA
- Retracement
- Aroon
INDICATORS LIST
LIST OF TOPICS
PRINT THIS ARTICLE
by David Penn
A bullish engulfing pattern in Zimmer Holdings is confirmed by positive divergences in both the stochastic and the MACD histogram.
Position: N/A
David Penn
Technical Writer for Technical Analysis of STOCKS & COMMODITIES magazine, Working-Money.com, and Traders.com Advantage.
PRINT THIS ARTICLE
CANDLESTICK CHARTING
Medicals On The Move
07/28/06 12:09:35 PMby David Penn
A bullish engulfing pattern in Zimmer Holdings is confirmed by positive divergences in both the stochastic and the MACD histogram.
Position: N/A
| I suggested months ago in Working-Money.com that the economy was headed for a slowdown ("Counting on Consumers," May 1, 2006). At the time, you would have been hard pressed to find those who agreed with me. I certainly was. Everywhere I turned, the idea was pooh-poohed--until it became increasingly untenable to deny the obvious fact that consumer staples stocks were starting to move higher and growth stocks--such as technology and biotechnology--weren't coming back any time soon. |

|
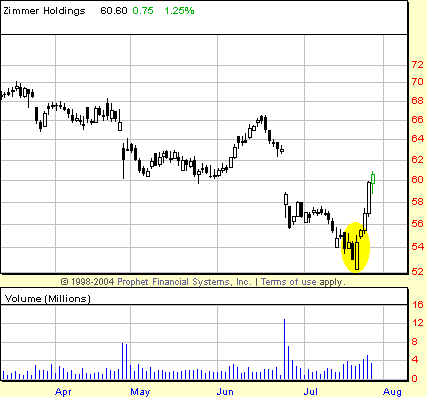
| Figure 1: Zimmer Holdings, Daily. This bullish engulfing pattern could also be seen as a bullish belt-hold pattern. In either event, a clear signal was provided to candlestick traders that the correction in Zimmer had likely run its course. |
| Graphic provided by: Prophet Financial, Inc. |
| |
| Part of the cohort of stocks that tends to do well as the spectre of an economic slowdown looms is the health care group. This somewhat loosely defined cadre tends to include everything medical from pharmaceuticals to hospitals/healthcare facilities to medical device makers such as Zimmer Holdings. |
| Zimmer Holdings entered the spring of 2006 in a downtrend, making lower lows in April, May, June and July. During the downtrend in July however, ZMH had a session in which prices opened lower than the previous session's low (in fact, they opened at the low for the entire, multi-month decline), but then closed more than two points higher, within cents of the previous day's high. This combination, along with the fact that the initial day was a "down" day and the subsequent day was an "up" day, is characteristic of a bullish engulfing pattern. Japanese candlestick expert, Steve Nison describes such candlesticks in his book, Japanese Candlestick Charting Techniques: The engulfing pattern is a major reversal signal with two opposite color real bodies composing this pattern ... The market is in a downtrend, then a white bullish real body wraps around, or engulfs, the prior period's black real body. This shows buying pressure has overwhelmed selling pressure. |

|
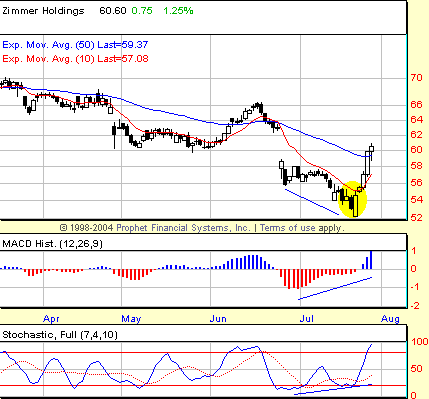
| Figure 2: Zimmer Holdings, Daily. Positive divergences in both the MACD histogram and the stochastic support the bullish engulfing pattern created in ZMH late in July. |
| Graphic provided by: Prophet Financial, Inc. |
| |
| I wrote recently about technical combinations using candlestick analysis and indicator analysis ("Candlesticks and Patterns," Traders.com Advantage, July 27, 2006). The current example of ZMH gives us another chance to see candlesticks and indicators at work reinforcing each other's signals. In Figure 2, we have the bullish engulfing pattern highlighted. Note how, as Zimmer is making new lows going into the engulfing pattern, both the stochastic and the MACD histogram are making higher lows. These positive divergences in the indicators are providing a high degree of confirmation that the engulfing pattern is valid and that higher prices were likely in the near-term. |
| Trading ZMH using the histochastic method would have actually positioned a trader quite well for this bottom. On July 19th we have both a confirmed, positive stochastic divergence (the higher low in the stochastic is confirmed when it curls upward after making the low point the day before) as well as a confirmed, positive MACD histogram divergence (confirmed when the histogram ticks up). That makes July 19th a "point day" with the "point" (again, the term borrowed from the world of craps) being half the range of the "point day" added to the high. This means a long entry at 55.92, which is filled on July 25th. The trade closes nicely in the money (July 25th closed at 57.02) and two days later could have been profitably exited with a 4+ point gain. |
Technical Writer for Technical Analysis of STOCKS & COMMODITIES magazine, Working-Money.com, and Traders.com Advantage.
| Title: | Technical Writer |
| Company: | Technical Analysis, Inc. |
| Address: | 4757 California Avenue SW |
| Seattle, WA 98116 | |
| Phone # for sales: | 206 938 0570 |
| Fax: | 206 938 1307 |
| Website: | www.Traders.com |
| E-mail address: | DPenn@traders.com |
Traders' Resource Links | |
| Charting the Stock Market: The Wyckoff Method -- Books | |
| Working-Money.com -- Online Trading Services | |
| Traders.com Advantage -- Online Trading Services | |
| Technical Analysis of Stocks & Commodities -- Publications and Newsletters | |
| Working Money, at Working-Money.com -- Publications and Newsletters | |
| Traders.com Advantage -- Publications and Newsletters | |
| Professional Traders Starter Kit -- Software | |
Click here for more information about our publications!
Comments
Date: 08/04/06Rank: 3Comment:

|

Request Information From Our Sponsors
- StockCharts.com, Inc.
- Candle Patterns
- Candlestick Charting Explained
- Intermarket Technical Analysis
- John Murphy on Chart Analysis
- John Murphy's Chart Pattern Recognition
- John Murphy's Market Message
- MurphyExplainsMarketAnalysis-Intermarket Analysis
- MurphyExplainsMarketAnalysis-Visual Analysis
- StockCharts.com
- Technical Analysis of the Financial Markets
- The Visual Investor
- VectorVest, Inc.
- Executive Premier Workshop
- One-Day Options Course
- OptionsPro
- Retirement Income Workshop
- Sure-Fire Trading Systems (VectorVest, Inc.)
- Trading as a Business Workshop
- VectorVest 7 EOD
- VectorVest 7 RealTime/IntraDay
- VectorVest AutoTester
- VectorVest Educational Services
- VectorVest OnLine
- VectorVest Options Analyzer
- VectorVest ProGraphics v6.0
- VectorVest ProTrader 7
- VectorVest RealTime Derby Tool
- VectorVest Simulator
- VectorVest Variator
- VectorVest Watchdog
