HOT TOPICS LIST
- MACD
- Fibonacci
- RSI
- Gann
- ADXR
- Stochastics
- Volume
- Triangles
- Futures
- Cycles
- Volatility
- ZIGZAG
- MESA
- Retracement
- Aroon
INDICATORS LIST
LIST OF TOPICS
PRINT THIS ARTICLE
by Koos van der Merwe
Lifestyle trendsetter Martha Stewart's television show, Martha, saw advertising soar.
Position: Accumulate
Koos van der Merwe
Has been a technical analyst since 1969, and has worked as a futures and options trader with First Financial Futures in Johannesburg, South Africa.
PRINT THIS ARTICLE
ANDREWS PITCH-FORK
Is It Time To Buy Martha?
07/28/06 09:51:37 AMby Koos van der Merwe
Lifestyle trendsetter Martha Stewart's television show, Martha, saw advertising soar.
Position: Accumulate
| Shares of MSO climbed 10% on July 26th, the most in almost four months, after the company said it had narrowed second quarter losses. They beat analysts' estimates as magazine advertising and sales from Martha's television show jumped. The company also said that it will pay a one-time dividend of US$50c a share in September. So, should now load up on MSO shares? "We have successfully navigated a difficult period and are enjoying significant gains in advertising revenue and new business opportunities," said Susan Lyne, president and chief executive of Martha Stewart Living. |
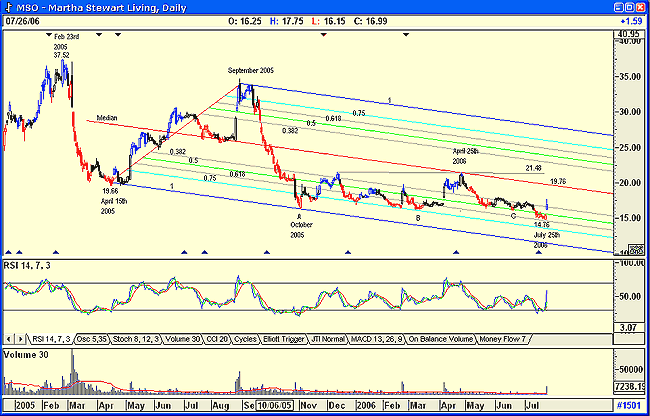
| Below is a daily chart of MSO showing the stock reaching a high of $37.52 in February, just before Martha was released from prison in March 2005. But since then it has fallen, with the obvious corrections shown on the chart, to a low of $14.76 by July 25th, 2006. The correction was on hopes that with her release, and new TV show, the Apprentice, she would revive the company's fortunes. But the show did not prove as popular as expected, and her efforts proved to be more difficult than she had anticipated. |

|
| Figure 1: A daily chart of MSO analyzed using Andrews pitchfork. |
| Graphic provided by: AdvancedGET. |
| |
| To analyze the chart, I have used a variation of Andrews pitchfork supplied by the Advanced GET program. Dr. Alan Andrews developed this technique of drawing a pitchfork based upon a median line. His rules state that the market will do one of two things as it approaches the median line: 1. The market will reverse at the median line. 2. The market will trade through the median line and head for the upper parallel line and then reverse. Advanced GET allows a user to insert Fibonocci ratio lines in between the median line and the upper and lower parallels. Also, when there is a steep decline, as shown in the chart, the program suggests using a modification that will automatically adjust the direction and spacing of the pitchfork to compensate for the steepness of the retracement. Because of the steep fall from September 2005 to October 2005, I have applied the modification. Note how the modification picked up the support at A, at B at C and at July 25th 2006. Note too how the median line acted as a resistance on April 25th, 2006. What can we now expect? The RSI signal has given a "buy," supported by increasing volume, so we could expect the price to rise and test the median line at approximately the $19.76 level. Should it break above this level, we could look for resistance at the various Fibonacci levels between the median and upper line, as shown on the chart. |
| Is MSO a buy? My chart is saying yes, but keep a close eye on the various resistance levels on the way up, and above all, don't buck the trend of the general market. |
Has been a technical analyst since 1969, and has worked as a futures and options trader with First Financial Futures in Johannesburg, South Africa.
| Address: | 3256 West 24th Ave |
| Vancouver, BC | |
| Phone # for sales: | 6042634214 |
| E-mail address: | petroosp@gmail.com |
Click here for more information about our publications!
Comments
Date: 08/04/06Rank: 3Comment:

Request Information From Our Sponsors
- StockCharts.com, Inc.
- Candle Patterns
- Candlestick Charting Explained
- Intermarket Technical Analysis
- John Murphy on Chart Analysis
- John Murphy's Chart Pattern Recognition
- John Murphy's Market Message
- MurphyExplainsMarketAnalysis-Intermarket Analysis
- MurphyExplainsMarketAnalysis-Visual Analysis
- StockCharts.com
- Technical Analysis of the Financial Markets
- The Visual Investor
- VectorVest, Inc.
- Executive Premier Workshop
- One-Day Options Course
- OptionsPro
- Retirement Income Workshop
- Sure-Fire Trading Systems (VectorVest, Inc.)
- Trading as a Business Workshop
- VectorVest 7 EOD
- VectorVest 7 RealTime/IntraDay
- VectorVest AutoTester
- VectorVest Educational Services
- VectorVest OnLine
- VectorVest Options Analyzer
- VectorVest ProGraphics v6.0
- VectorVest ProTrader 7
- VectorVest RealTime Derby Tool
- VectorVest Simulator
- VectorVest Variator
- VectorVest Watchdog
