HOT TOPICS LIST
- MACD
- Fibonacci
- RSI
- Gann
- ADXR
- Stochastics
- Volume
- Triangles
- Futures
- Cycles
- Volatility
- ZIGZAG
- MESA
- Retracement
- Aroon
INDICATORS LIST
LIST OF TOPICS
PRINT THIS ARTICLE
by Arthur Hill
American Express (AXP) formed a double top in 2006, but support is refusing to go quietly and the pattern has yet to be confirmed.
Position: Hold
Arthur Hill
Arthur Hill is currently editor of TDTrader.com, a website specializing in trading strategies, sector/industry specific breadth stats and overall technical analysis. He passed the Society of Technical Analysts (STA London) diploma exam with distinction is a Certified Financial Technician (CFTe). Prior to TD Trader, he was the Chief Technical Analyst for Stockcharts.com and the main contributor to the ChartSchool.
PRINT THIS ARTICLE
DOUBLE TOPS
American Express Flirts With Double Top Support
07/27/06 01:02:09 PMby Arthur Hill
American Express (AXP) formed a double top in 2006, but support is refusing to go quietly and the pattern has yet to be confirmed.
Position: Hold
| The double top is one of the more reliable bearish patterns in technical analysis. However, reliability increases when one waits for confirmation with a support break. AXP pierced support over the last few days, but a convincing break remains elusive and the pattern is as yet unconfirmed. |

|
| Graphic provided by: MetaStock. |
| |
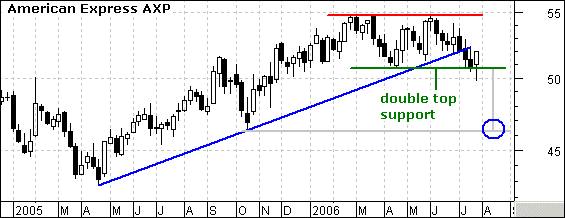
| First, let's look at the double top on the weekly chart. The stock advanced from the low 40s and met resistance around 55 in February, March and June. The stock formed a reaction low at 50.77 in between the March and June peaks and this level holds the key to the double top. A convincing break below 50.77 would confirm the double top and project further weakness to around 46 (blue oval). |

|
| Graphic provided by: MetaStock. |
| |
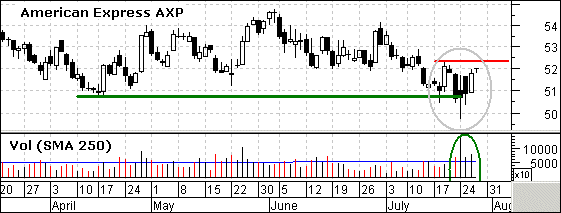
| Just what is a convincing break anyway? On the daily chart, the stock pierced support four times over the last two weeks and closed below 50.77 twice last week (gray oval). However, the stock rebounded in the next day or two and the support break did not hold. A filter is needed to validate the support break. This can be a price and/or time filter. A close below 50 could, or three days below support will help insure that the support break is valid. |
| Right now, support is holding and the stock actually advanced on above average volume the last three days. This is impressive and a break above the reaction high at 52.35 (red line) would be short-term bullish. |
Arthur Hill is currently editor of TDTrader.com, a website specializing in trading strategies, sector/industry specific breadth stats and overall technical analysis. He passed the Society of Technical Analysts (STA London) diploma exam with distinction is a Certified Financial Technician (CFTe). Prior to TD Trader, he was the Chief Technical Analyst for Stockcharts.com and the main contributor to the ChartSchool.
| Title: | Editor |
| Company: | TDTrader.com |
| Address: | Willem Geetsstraat 17 |
| Mechelen, B2800 | |
| Phone # for sales: | 3215345465 |
| Website: | www.tdtrader.com |
| E-mail address: | arthurh@tdtrader.com |
Traders' Resource Links | |
| TDTrader.com has not added any product or service information to TRADERS' RESOURCE. | |
Click here for more information about our publications!
Comments
Date: 08/01/06Rank: 4Comment:
Date: 08/04/06Rank: 4Comment:

Request Information From Our Sponsors
- StockCharts.com, Inc.
- Candle Patterns
- Candlestick Charting Explained
- Intermarket Technical Analysis
- John Murphy on Chart Analysis
- John Murphy's Chart Pattern Recognition
- John Murphy's Market Message
- MurphyExplainsMarketAnalysis-Intermarket Analysis
- MurphyExplainsMarketAnalysis-Visual Analysis
- StockCharts.com
- Technical Analysis of the Financial Markets
- The Visual Investor
- VectorVest, Inc.
- Executive Premier Workshop
- One-Day Options Course
- OptionsPro
- Retirement Income Workshop
- Sure-Fire Trading Systems (VectorVest, Inc.)
- Trading as a Business Workshop
- VectorVest 7 EOD
- VectorVest 7 RealTime/IntraDay
- VectorVest AutoTester
- VectorVest Educational Services
- VectorVest OnLine
- VectorVest Options Analyzer
- VectorVest ProGraphics v6.0
- VectorVest ProTrader 7
- VectorVest RealTime Derby Tool
- VectorVest Simulator
- VectorVest Variator
- VectorVest Watchdog
