HOT TOPICS LIST
- MACD
- Fibonacci
- RSI
- Gann
- ADXR
- Stochastics
- Volume
- Triangles
- Futures
- Cycles
- Volatility
- ZIGZAG
- MESA
- Retracement
- Aroon
INDICATORS LIST
LIST OF TOPICS
PRINT THIS ARTICLE
by Luis Ferro
3M's recent price action led to a breakdown from a small, short-term congestion pattern. At the same time prices also completed a long-term double top pattern.
Position: Sell
Luis Ferro
Trader and technical analyst living in Bern, Switzerland. A full member of the STA, currently enrolled in the DITA program and the CMT program.
PRINT THIS ARTICLE
ISLAND REVERSAL
Double Breakdown For 3M
07/27/06 12:56:13 PMby Luis Ferro
3M's recent price action led to a breakdown from a small, short-term congestion pattern. At the same time prices also completed a long-term double top pattern.
Position: Sell
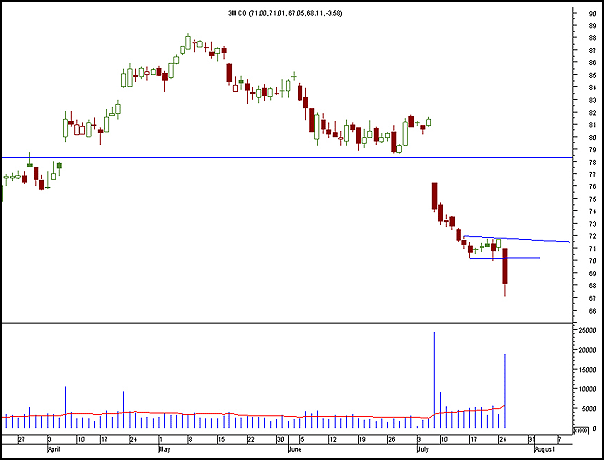
| The daily candlestick chart below shows the behavior of 3M for the last four months. Following a rally that took prices to a high of 88.35 in the beginning of May, 3M initiated a correction that lasted until now. The downtrend was not very strong initially, with prices slowly drifting downwards, but on July 7, following a breakaway gap, the fall in prices accelerated significantly. Prices closed at 81.39 on the day before the gap and opened at 76.28, a loss of 6.27%. Volume was over 24 million shares, versus an average of 3.5 million on the last 20 trading days (almost seven times higher). But the level at which the gap occurred was also extremely important. |

|
| Figure 1: Daily candletick chart of 3M, showing the gap levels and the small congetion. |
| Graphic provided by: MetaStock. |
| |
| It was at the same level as a previous gap that occurred on April 4, and therefore an island reversal pattern was formed. Island reversals are much more common that one would expect (especially if markets were indeed random) as there seems to a tendency for gaps to occur at the same level. This is a significant reversal pattern and the price objective, which is equal to the height of the pattern, is often reached, but it can be difficult to trade. The reason is that the second gap can be very strong and take prices far away, therefore reducing a possible reward and increasing the risk. The volatility also has a tendency to increase substantially, so timing has to be very good. |
| The island reversal had bearish implications and indeed 3M continued to fall until it reached a low of 70.17. At this point a flag-like congestion was formed that lasted for five days. However, on the last trading session 3M broke below the 70 level with a strong range expansion day. Volume was once more very high (which is always good on breakdowns), with almost 19 million shares traded, well above the trading volume of the last two weeks. From the analysis of the daily chart it looks like 3M will indeed continue to fall, at least in the short-term. |

|
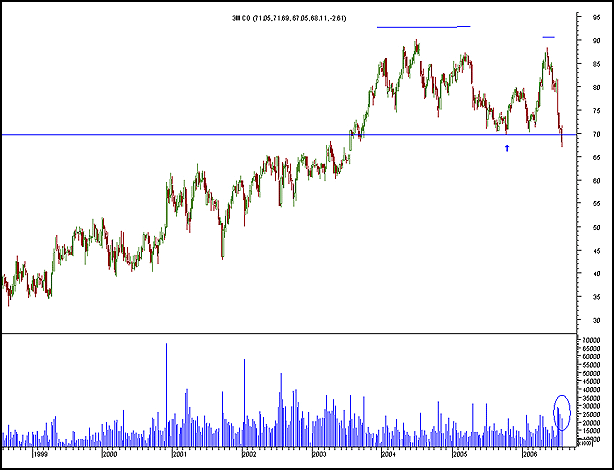
| Figure 2: Weekly chart of 3M showing the double top and the breakdown level, and the strong volume of the last weeks. |
| Graphic provided by: MetaStock. |
| |
| 3M's weekly chart allows for an easy analysis of the long-term trend. The first point is that 3M broke below the previous low of 69.71 made on October 2005 and that volume has been consistently high in the last four weeks( highlighted with a circle on the chart), supporting the consistency of the breakdown. The long-term congestion is in fact a double top (the two double tops are marked on the chart and the first one is relatively long). The price target for this double top would be at around the 50 level. However, it is more difficult for price targets to be reached in the case of bearish patterns than in the case of bullish patterns. Either way, the simultaneous breakdown on both the short- and long-term is strongly bearish and an excellent candidate for a short sale. |
Trader and technical analyst living in Bern, Switzerland. A full member of the STA, currently enrolled in the DITA program and the CMT program.
| Address: | Switzerland |
| E-mail address: | luispgsf@yahoo.com |
Click here for more information about our publications!
Comments
Date: 08/04/06Rank: 3Comment:

Request Information From Our Sponsors
- StockCharts.com, Inc.
- Candle Patterns
- Candlestick Charting Explained
- Intermarket Technical Analysis
- John Murphy on Chart Analysis
- John Murphy's Chart Pattern Recognition
- John Murphy's Market Message
- MurphyExplainsMarketAnalysis-Intermarket Analysis
- MurphyExplainsMarketAnalysis-Visual Analysis
- StockCharts.com
- Technical Analysis of the Financial Markets
- The Visual Investor
- VectorVest, Inc.
- Executive Premier Workshop
- One-Day Options Course
- OptionsPro
- Retirement Income Workshop
- Sure-Fire Trading Systems (VectorVest, Inc.)
- Trading as a Business Workshop
- VectorVest 7 EOD
- VectorVest 7 RealTime/IntraDay
- VectorVest AutoTester
- VectorVest Educational Services
- VectorVest OnLine
- VectorVest Options Analyzer
- VectorVest ProGraphics v6.0
- VectorVest ProTrader 7
- VectorVest RealTime Derby Tool
- VectorVest Simulator
- VectorVest Variator
- VectorVest Watchdog
