HOT TOPICS LIST
- MACD
- Fibonacci
- RSI
- Gann
- ADXR
- Stochastics
- Volume
- Triangles
- Futures
- Cycles
- Volatility
- ZIGZAG
- MESA
- Retracement
- Aroon
INDICATORS LIST
LIST OF TOPICS
PRINT THIS ARTICLE
by David Penn
What do you get when you cross a bearish engulfing pattern with a 2B top--and a negative stochastic divergence?
Position: N/A
David Penn
Technical Writer for Technical Analysis of STOCKS & COMMODITIES magazine, Working-Money.com, and Traders.com Advantage.
PRINT THIS ARTICLE
CANDLESTICK CHARTING
Candlesticks And Patterns
07/27/06 11:56:29 AMby David Penn
What do you get when you cross a bearish engulfing pattern with a 2B top--and a negative stochastic divergence?
Position: N/A
| Some questions answer themselves--and the above intro is likely one of them. Bearish engulfing candlesticks, as my colleague Dennis Petersen has pointed out, are some of the highest percentage reversal patterns in the entire pantheon of Japanese candlestick patterns. And when their bearish signal is confirmed by other patterns--such as Sperandeo's 2B top--as well as other indicators like the stochastic, then a speculator can often have an unusually strong degree of confidence that near-term prices will be lower. |

|
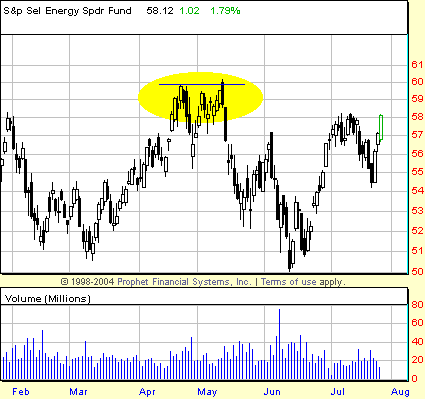
| Figure 1: S&P Select Energy SPDR Fund, Daily. An April-May 2B top signaled the end of the advance for XLE. That the 2B top was created in part by a bearish engulfing candlestick pattern was an especially worthwhile confirmation of the impending reversal. |
| Graphic provided by: Prophet Financial, Inc. |
| |
| I've been trying to make it a habit to look at charts without indicators first, make an assessment, and THEN add the indicators. Call it going back to basics, getting "old school," whatever. I would just hate to end up as one of those technicians that is helpless without moving averages and oscillators and a whole bunch of what Aldous Huxley (in an entirely different context) referred to as "gratuitous graces"--meaning, neither necessary nor sufficient, but nonetheless miraculous. |
| The chart of the S&P Select Energy SPDR Fund, XLE, is a good example of what the unadorned price and volume chart can reveal. Notice how as the XLE moves toward mid-May prices make a new high, but then fail rather dramatically to follow-through to the upside. That act, in and of itself, is the hallmark of a 2B top. Trading a 2B top, as Victor Sperandeo instructs, involves selling when the market reaches the low of the session that marked the initial high. In this case, that would mean selling--or setting a sell stop--at the low of the late April session on the 21st at about 58.52. Such a stop would have been triggered early in the session immediately following the bearish engulfing session. By the close of the entry day, the speculator would already be more than a point and a half in the black. |

|
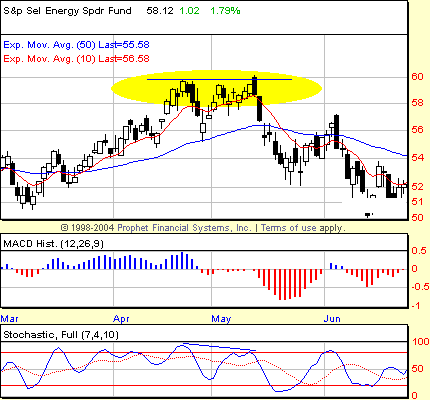
| Figure 2: S&P Select Energy SPDR Fund, Daily. A month-on-month, negative stochastic divergence helped confirm other technical clues that the XLE was ripe for reversal. |
| Graphic provided by: Prophet Financial, Inc. |
| |
| Bringing the indicators back to the picture only gives confirmation to the analysis provided from the indicator-free version: namely, that a top of some significance was building in the XLE in the late spring of 2006. Here, the confirmation was provided by a month-on-month, negative divergence in the stochastic. I've written before that negative divergences are excellent compliments to a successful 2B top, signifying as they do the same sort of loss of momentum that the 2B top itself hints at. Such divergences may not as frequently be helpful with bearish engulfing patterns, insofar as such patterns do not require the twin peaks of a 2B top or a negative stochastic divergence. Nevertheless, when all three come together, speculators often have an excellent opportunity to the short side on their hands. |
| I mentioned how to trade XLE without the indicators. Using the histochastic method I've written about frequently before, the trade would have provided for an entry the day after the bearish engulfing session. In order to trade a negative divergence, I need both the stochastic and the MACD histogram to have peaked and ticked downward. That wasn't accomplished until the May 12th session. Taking half the range of that session and subtracting it from the low of that session gave me a short entry at 55.73. That order would have been filled on the 15th, with a close that left the trade in the black (slightly) after day one. Three days later, the position was up in excess of two points and ripe for profit-taking from a swing trading perspective. |
Technical Writer for Technical Analysis of STOCKS & COMMODITIES magazine, Working-Money.com, and Traders.com Advantage.
| Title: | Technical Writer |
| Company: | Technical Analysis, Inc. |
| Address: | 4757 California Avenue SW |
| Seattle, WA 98116 | |
| Phone # for sales: | 206 938 0570 |
| Fax: | 206 938 1307 |
| Website: | www.Traders.com |
| E-mail address: | DPenn@traders.com |
Traders' Resource Links | |
| Charting the Stock Market: The Wyckoff Method -- Books | |
| Working-Money.com -- Online Trading Services | |
| Traders.com Advantage -- Online Trading Services | |
| Technical Analysis of Stocks & Commodities -- Publications and Newsletters | |
| Working Money, at Working-Money.com -- Publications and Newsletters | |
| Traders.com Advantage -- Publications and Newsletters | |
| Professional Traders Starter Kit -- Software | |
Click here for more information about our publications!
Comments
Date: 08/01/06Rank: 4Comment:
Date: 08/04/06Rank: 3Comment:

Request Information From Our Sponsors
- StockCharts.com, Inc.
- Candle Patterns
- Candlestick Charting Explained
- Intermarket Technical Analysis
- John Murphy on Chart Analysis
- John Murphy's Chart Pattern Recognition
- John Murphy's Market Message
- MurphyExplainsMarketAnalysis-Intermarket Analysis
- MurphyExplainsMarketAnalysis-Visual Analysis
- StockCharts.com
- Technical Analysis of the Financial Markets
- The Visual Investor
- VectorVest, Inc.
- Executive Premier Workshop
- One-Day Options Course
- OptionsPro
- Retirement Income Workshop
- Sure-Fire Trading Systems (VectorVest, Inc.)
- Trading as a Business Workshop
- VectorVest 7 EOD
- VectorVest 7 RealTime/IntraDay
- VectorVest AutoTester
- VectorVest Educational Services
- VectorVest OnLine
- VectorVest Options Analyzer
- VectorVest ProGraphics v6.0
- VectorVest ProTrader 7
- VectorVest RealTime Derby Tool
- VectorVest Simulator
- VectorVest Variator
- VectorVest Watchdog
