HOT TOPICS LIST
- MACD
- Fibonacci
- RSI
- Gann
- ADXR
- Stochastics
- Volume
- Triangles
- Futures
- Cycles
- Volatility
- ZIGZAG
- MESA
- Retracement
- Aroon
INDICATORS LIST
LIST OF TOPICS
PRINT THIS ARTICLE
by Arthur Hill
Despite a decline over the last three months, key volume indicators have remained strong for Waste Management (WMI) and the correction may be nearing its end.
Position: Accumulate
Arthur Hill
Arthur Hill is currently editor of TDTrader.com, a website specializing in trading strategies, sector/industry specific breadth stats and overall technical analysis. He passed the Society of Technical Analysts (STA London) diploma exam with distinction is a Certified Financial Technician (CFTe). Prior to TD Trader, he was the Chief Technical Analyst for Stockcharts.com and the main contributor to the ChartSchool.
PRINT THIS ARTICLE
ACCUM./DIST. CHAIKIN
Signs Of Accumulation In WMI
07/27/06 08:38:09 AMby Arthur Hill
Despite a decline over the last three months, key volume indicators have remained strong for Waste Management (WMI) and the correction may be nearing its end.
Position: Accumulate
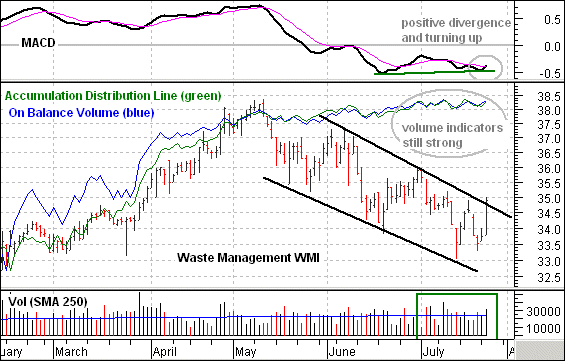
| I am using two volume-based indicators to measure buying and selling pressure. On-balance volume adds volume on up days and subtracts it on down days (closing basis). The accumulation/distribution line adds volume when the close is above the mid-point of the high-low range and subtracts volume when the close is below the mid-point. On-balance volume works from one close to the next and the accumulation/distribution line works with a single day's price action. This makes them complimentary and valuable when used together. |

|
| Graphic provided by: MetaStock. |
| |
| While the stock declined from May to July, the accumulation/distribution line and on-balance volume continued higher. This may seem strange, but it shows that upside volume has been stronger than downside volume from close-to-close AND intraday. Taken together, these indicators show accumulation on the way down and this is quite positive. |
| While these volume indicators shows signs of accumulation, the price chart shows a clear downtrend. The stock formed lower lows and lower highs the last two months. There was a big surge on Tuesday and this broke the upper trendline. Volume was above average and this is the start of a trend reversal. |
| In addition to Tuesday's surge, MACD has a positive divergence working and moved above its signal line. Momentum is turning up again and this stock appears to be putting in a bottom. Tuesday's surge in just one day and a little follow through would be nice for confirmation. Failure to hold the trendline break and a move below 33 would negate these early signs of strength. |
Arthur Hill is currently editor of TDTrader.com, a website specializing in trading strategies, sector/industry specific breadth stats and overall technical analysis. He passed the Society of Technical Analysts (STA London) diploma exam with distinction is a Certified Financial Technician (CFTe). Prior to TD Trader, he was the Chief Technical Analyst for Stockcharts.com and the main contributor to the ChartSchool.
| Title: | Editor |
| Company: | TDTrader.com |
| Address: | Willem Geetsstraat 17 |
| Mechelen, B2800 | |
| Phone # for sales: | 3215345465 |
| Website: | www.tdtrader.com |
| E-mail address: | arthurh@tdtrader.com |
Traders' Resource Links | |
| TDTrader.com has not added any product or service information to TRADERS' RESOURCE. | |
Click here for more information about our publications!
Comments
Date: 08/04/06Rank: 5Comment:

Request Information From Our Sponsors
- VectorVest, Inc.
- Executive Premier Workshop
- One-Day Options Course
- OptionsPro
- Retirement Income Workshop
- Sure-Fire Trading Systems (VectorVest, Inc.)
- Trading as a Business Workshop
- VectorVest 7 EOD
- VectorVest 7 RealTime/IntraDay
- VectorVest AutoTester
- VectorVest Educational Services
- VectorVest OnLine
- VectorVest Options Analyzer
- VectorVest ProGraphics v6.0
- VectorVest ProTrader 7
- VectorVest RealTime Derby Tool
- VectorVest Simulator
- VectorVest Variator
- VectorVest Watchdog
- StockCharts.com, Inc.
- Candle Patterns
- Candlestick Charting Explained
- Intermarket Technical Analysis
- John Murphy on Chart Analysis
- John Murphy's Chart Pattern Recognition
- John Murphy's Market Message
- MurphyExplainsMarketAnalysis-Intermarket Analysis
- MurphyExplainsMarketAnalysis-Visual Analysis
- StockCharts.com
- Technical Analysis of the Financial Markets
- The Visual Investor
