HOT TOPICS LIST
- MACD
- Fibonacci
- RSI
- Gann
- ADXR
- Stochastics
- Volume
- Triangles
- Futures
- Cycles
- Volatility
- ZIGZAG
- MESA
- Retracement
- Aroon
INDICATORS LIST
LIST OF TOPICS
PRINT THIS ARTICLE
by David Penn
A 2B top at the weekly level and a pair of negative divergences at the daily level suggest that the upside in crude might be limited in the near-term.
Position: N/A
David Penn
Technical Writer for Technical Analysis of STOCKS & COMMODITIES magazine, Working-Money.com, and Traders.com Advantage.
PRINT THIS ARTICLE
REVERSAL
Cracks In The Crude
07/25/06 01:07:25 PMby David Penn
A 2B top at the weekly level and a pair of negative divergences at the daily level suggest that the upside in crude might be limited in the near-term.
Position: N/A
| I recently wondered in an article for Traders.com Advantage about the underperformance of oil stocks during a time when there was so much conflict of late in the Middle East ("A Head and Shoulders Top in Oil Service?" July 21, 2006). I want to join those observations about oil stocks with this look at crude oil itself to see if there are patterns in the long and intermediate term charts of crude oil that support the apparent bearishness in the stocks. |

|
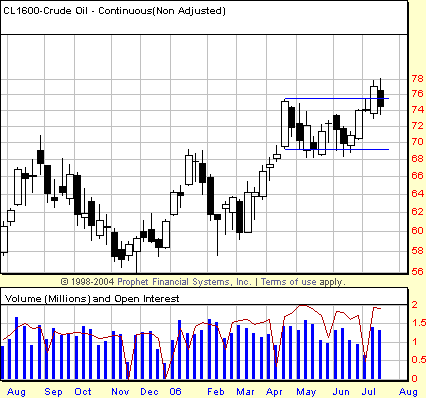
| Figure 1: Crude oil futures, Continuous, Weekly. Failure to follow through after higher highs were made in mid-July makes possible a softening in crude oil prices in the second half of the summer. |
| Graphic provided by: Prophet Financial, Inc. |
| |
| Looking at the weekly chart of crude oil (basis continuous futures), my attention is drawn toward the consolidation in the late spring and early summer of 2006. This consolidation comes in the wake of the strong surge higher in April, during which time crude oil futures topped $75. Crude oil spent the next two months oscillating between--roughly 74 and 68 before breaking out in the first half of July. |
| The breakout appears valid. But the fact that the market pulled back during the following week raises the spectre of a bull trap. A bull trap is just another way of talking about a market that breaks out in a given session, only to turn around and reverse itself in the following session (or one shortly thereafter). Speculators have created trading setups around the phenomenon of bull traps, setups called 2B (Sperandeo) and Turtle Soup (Connors) and have pointed to such instances as often remarkably good opportunities to speculate on a reversal in a market before that reversal becomes more apparent to a wider group of traders and speculators. |

|
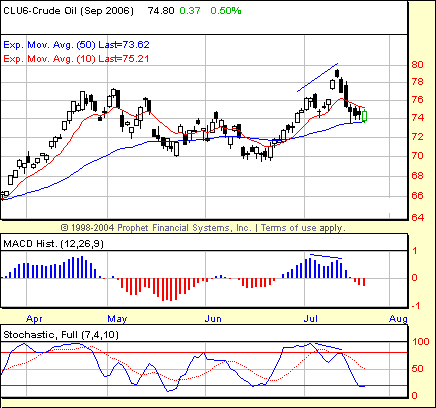
| Figure 2: Crude oil futures, September, Daily. Negative divergences in both the stochastic and the MACD histogram suggest that the bounce that began in mid-June may be running out of steam. |
| Graphic provided by: Prophet Financial, Inc. |
| |
| If there are signs of a potential for breakdown in the weekly chart, then we should be able to find similar signs in the daily chart. As the daily chart of September crude shows in Figure 2, there are in fact signs of waning momentum moving toward the end of July. These signs are negative or bearish divergences in both the MACD histogram and in the stochastic. While these divergences do not necessarily spell reversal, they do indicate that there has been a loss of momentum to the upside and that--over the near-term--sideways to lower prices are more likely than advancing ones. |
| Looking up from the specifics of crude oil to the bigger picture I have been painting for the past several weeks in Traders.com Advantage and Working-Money.com, it appears as if the charts I study are indicating a drop in commodity prices, possibly coinciding with a pullback in long-term interest rates and a short-term advance in the stock market. For me, this is a pre-recession position, with energy and basic materials stocks and commodities rolling over and defensive instruments--such as consumer staples stocks and bonds--moving higher up the list of investor preferences. For more on the pre-recession pattern of sector rotation, see my "Counting on Consumers," published this spring in Working-Money.com. |
Technical Writer for Technical Analysis of STOCKS & COMMODITIES magazine, Working-Money.com, and Traders.com Advantage.
| Title: | Technical Writer |
| Company: | Technical Analysis, Inc. |
| Address: | 4757 California Avenue SW |
| Seattle, WA 98116 | |
| Phone # for sales: | 206 938 0570 |
| Fax: | 206 938 1307 |
| Website: | www.Traders.com |
| E-mail address: | DPenn@traders.com |
Traders' Resource Links | |
| Charting the Stock Market: The Wyckoff Method -- Books | |
| Working-Money.com -- Online Trading Services | |
| Traders.com Advantage -- Online Trading Services | |
| Technical Analysis of Stocks & Commodities -- Publications and Newsletters | |
| Working Money, at Working-Money.com -- Publications and Newsletters | |
| Traders.com Advantage -- Publications and Newsletters | |
| Professional Traders Starter Kit -- Software | |
Click here for more information about our publications!
Comments
Date: 08/01/06Rank: 5Comment:
Date: 08/04/06Rank: 3Comment:

Request Information From Our Sponsors
- StockCharts.com, Inc.
- Candle Patterns
- Candlestick Charting Explained
- Intermarket Technical Analysis
- John Murphy on Chart Analysis
- John Murphy's Chart Pattern Recognition
- John Murphy's Market Message
- MurphyExplainsMarketAnalysis-Intermarket Analysis
- MurphyExplainsMarketAnalysis-Visual Analysis
- StockCharts.com
- Technical Analysis of the Financial Markets
- The Visual Investor
- VectorVest, Inc.
- Executive Premier Workshop
- One-Day Options Course
- OptionsPro
- Retirement Income Workshop
- Sure-Fire Trading Systems (VectorVest, Inc.)
- Trading as a Business Workshop
- VectorVest 7 EOD
- VectorVest 7 RealTime/IntraDay
- VectorVest AutoTester
- VectorVest Educational Services
- VectorVest OnLine
- VectorVest Options Analyzer
- VectorVest ProGraphics v6.0
- VectorVest ProTrader 7
- VectorVest RealTime Derby Tool
- VectorVest Simulator
- VectorVest Variator
- VectorVest Watchdog
