HOT TOPICS LIST
- MACD
- Fibonacci
- RSI
- Gann
- ADXR
- Stochastics
- Volume
- Triangles
- Futures
- Cycles
- Volatility
- ZIGZAG
- MESA
- Retracement
- Aroon
INDICATORS LIST
LIST OF TOPICS
PRINT THIS ARTICLE
by Arthur Hill
An oversold oscillator and key support level could lead to a bounce in the Amex Cyclicals Index.
Position: Hold
Arthur Hill
Arthur Hill is currently editor of TDTrader.com, a website specializing in trading strategies, sector/industry specific breadth stats and overall technical analysis. He passed the Society of Technical Analysts (STA London) diploma exam with distinction is a Certified Financial Technician (CFTe). Prior to TD Trader, he was the Chief Technical Analyst for Stockcharts.com and the main contributor to the ChartSchool.
PRINT THIS ARTICLE
STOCHASTIC OSCILL
Amex Cyclical Index Reaches Key Support
07/24/06 08:23:25 AMby Arthur Hill
An oversold oscillator and key support level could lead to a bounce in the Amex Cyclicals Index.
Position: Hold
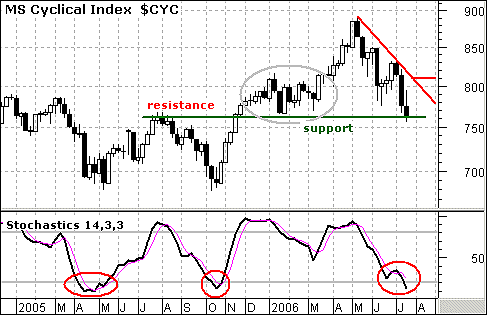
| With a sharp decline over the last 11 weeks, the Amex Cyclicals Index ($CYC) reached a major support zone around 760. Broken resistance and the January low mark support in this area. The index broke resistance with a strong move in November–December, and broken resistance turns into support. This was validated with a consolidation just above broken resistance and a successful test in January and February (gray oval). See Figure 1. |

|
| FIGURE 1: AMEX CYCLICAL INDEX. This index reached a major support zone around 760 with a sharp decline over the last 11 weeks. |
| Graphic provided by: MetaStock. |
| |
| In addition to support, the stochastic oscillator has become oversold for the third time in 18 months. The stochastic oscillator becomes oversold below 20 and overbought above 80. The oscillator dipped below 20 in April 2005, October 2005, and July 2006 (red ovals). As long as the oscillator remains below 20, it should be considered oversold and bearish. This is because the stochastic oscillator can become oversold and remain oversold. Look for a move back above 20 to signal a reversal. |
| On the price chart, my focus is on the trendline extending down from the May high. This trendline sets the tone of the current decline. As long as the index remains below this trendline, it has yet to break its fall. While the risk—reward ratio is good when the stock is oversold and near support, some strength is required to actually reverse the trend. I would at least make the index break the May trendline with a move above 810 to reverse the 11-week downtrend. |
Arthur Hill is currently editor of TDTrader.com, a website specializing in trading strategies, sector/industry specific breadth stats and overall technical analysis. He passed the Society of Technical Analysts (STA London) diploma exam with distinction is a Certified Financial Technician (CFTe). Prior to TD Trader, he was the Chief Technical Analyst for Stockcharts.com and the main contributor to the ChartSchool.
| Title: | Editor |
| Company: | TDTrader.com |
| Address: | Willem Geetsstraat 17 |
| Mechelen, B2800 | |
| Phone # for sales: | 3215345465 |
| Website: | www.tdtrader.com |
| E-mail address: | arthurh@tdtrader.com |
Traders' Resource Links | |
| TDTrader.com has not added any product or service information to TRADERS' RESOURCE. | |
Click here for more information about our publications!
Comments
Date: 07/26/06Rank: 5Comment:
Date: 08/04/06Rank: 4Comment:

Request Information From Our Sponsors
- StockCharts.com, Inc.
- Candle Patterns
- Candlestick Charting Explained
- Intermarket Technical Analysis
- John Murphy on Chart Analysis
- John Murphy's Chart Pattern Recognition
- John Murphy's Market Message
- MurphyExplainsMarketAnalysis-Intermarket Analysis
- MurphyExplainsMarketAnalysis-Visual Analysis
- StockCharts.com
- Technical Analysis of the Financial Markets
- The Visual Investor
- VectorVest, Inc.
- Executive Premier Workshop
- One-Day Options Course
- OptionsPro
- Retirement Income Workshop
- Sure-Fire Trading Systems (VectorVest, Inc.)
- Trading as a Business Workshop
- VectorVest 7 EOD
- VectorVest 7 RealTime/IntraDay
- VectorVest AutoTester
- VectorVest Educational Services
- VectorVest OnLine
- VectorVest Options Analyzer
- VectorVest ProGraphics v6.0
- VectorVest ProTrader 7
- VectorVest RealTime Derby Tool
- VectorVest Simulator
- VectorVest Variator
- VectorVest Watchdog
