HOT TOPICS LIST
- MACD
- Fibonacci
- RSI
- Gann
- ADXR
- Stochastics
- Volume
- Triangles
- Futures
- Cycles
- Volatility
- ZIGZAG
- MESA
- Retracement
- Aroon
INDICATORS LIST
LIST OF TOPICS
PRINT THIS ARTICLE
by Luis Ferro
The formation of a bearish candle pattern in Eaton Corp. suggests that the current short-term downtrend will probably resume its course.
Position: Sell
Luis Ferro
Trader and technical analyst living in Bern, Switzerland. A full member of the STA, currently enrolled in the DITA program and the CMT program.
PRINT THIS ARTICLE
CANDLESTICK CHARTING
Eaton Corp. And The Falling Three Methods Pattern
07/24/06 08:10:40 AMby Luis Ferro
The formation of a bearish candle pattern in Eaton Corp. suggests that the current short-term downtrend will probably resume its course.
Position: Sell
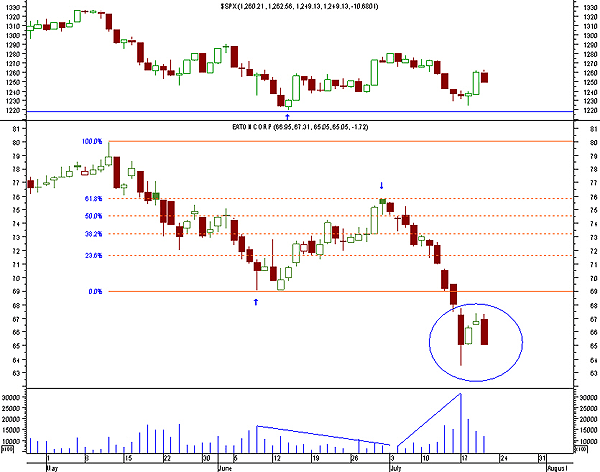
| After reaching a high of 80 on May 5, Eaton Corp. (ETN) initiated a corrective movement. The downtrend brought prices to the 69 level, and at that point, a hammer pattern formed with short-term bullish implications for the stock. The short-term uptrend that followed took ETN to 76, an almost perfect 61.8% Fibonacci retracement of the previous downtrend. At this level, a second hammerlike pattern occurred, but since it was formed following an uptrend, it is referred to as a hanging man and it is considered bearish. Prices again started to fall, and this downtrend only stopped at 63.50. It is important to note that volume declined steadily as prices rose, and once ETN started to fall again, volume increased. The volume decrease with rising prices may have occurred because the new price levels were not attracting many buyers, while the volume increase with declining prices was probably due to an increase in selling pressure, rather than a decrease in buying. |

|
| FIGURE 1: EATON CORP., DAILY. This candlestick chart shows the S&P 500 on the upper window and with the "falling three methods" pattern with a blue circle. |
| Graphic provided by: MetaStock. |
| |
| The upper window of Figure 1 shows the Standard & Poor's 500. Even though the S&P 500 is still above the previous low of 1220 on mid-June, ETN has already broken below the previous low of 69, which also occurred in mid-June. This means that not only is Eaton Corp. in a downtrend, but it is also underperforming the S&P 500 and the general market, something that is particularly bearish. |
| On the last trading session, ETN formed a bearish "falling three methods" pattern, indicating that the downtrend was likely to continue and lower prices could be expected. Most candlestick patterns are reversal patterns, but there are also a few candlestick continuation patterns. One such formation is the falling three methods. This bearish pattern has three distinctive components. The first is a long red candle, ideally opening near the top and closing near the bottom. The second component is made of three candles with small bodies, usually green candles, but the color is not really important. What is crucial is that the bodies of these last three candles remain within the range of the first day's strong red body. The pattern is completed with a long red candle that ideally should open below the close of the previous day and close below the close of the first day. This is the ideal pattern, but the falling three methods rarely occurs as a textbook example. |
| In the case of Eaton Corp., the first day was a long red candle that opened near the top, and although the close was not near the bottom, it is still acceptable. As for the second component, there were only two candles with small bodies, but that is also acceptable. This pattern can have fewer or more than three small bodies between the long red candles. The third component was a strong red candle, but the open was not below the previous day's close and the close was at the same level as the first day's close. (The difference was 0.01.) |
| The falling three methods formed by ETN has some obvious differences from an ideal pattern, but what is important is the philosophy behind the pattern, and in this case it remains valid, because the short-term rally (the two positive candles) was contained between the bodies of two red days. As a bearish continuation pattern it forecasts lower prices, something that is fully supported by the volume behavior and the stock performance relative to the S&P 500. |
Trader and technical analyst living in Bern, Switzerland. A full member of the STA, currently enrolled in the DITA program and the CMT program.
| Address: | Switzerland |
| E-mail address: | luispgsf@yahoo.com |
Click here for more information about our publications!
Comments
Date: 07/27/06Rank: 5Comment:

Request Information From Our Sponsors
- StockCharts.com, Inc.
- Candle Patterns
- Candlestick Charting Explained
- Intermarket Technical Analysis
- John Murphy on Chart Analysis
- John Murphy's Chart Pattern Recognition
- John Murphy's Market Message
- MurphyExplainsMarketAnalysis-Intermarket Analysis
- MurphyExplainsMarketAnalysis-Visual Analysis
- StockCharts.com
- Technical Analysis of the Financial Markets
- The Visual Investor
- VectorVest, Inc.
- Executive Premier Workshop
- One-Day Options Course
- OptionsPro
- Retirement Income Workshop
- Sure-Fire Trading Systems (VectorVest, Inc.)
- Trading as a Business Workshop
- VectorVest 7 EOD
- VectorVest 7 RealTime/IntraDay
- VectorVest AutoTester
- VectorVest Educational Services
- VectorVest OnLine
- VectorVest Options Analyzer
- VectorVest ProGraphics v6.0
- VectorVest ProTrader 7
- VectorVest RealTime Derby Tool
- VectorVest Simulator
- VectorVest Variator
- VectorVest Watchdog
