HOT TOPICS LIST
- MACD
- Fibonacci
- RSI
- Gann
- ADXR
- Stochastics
- Volume
- Triangles
- Futures
- Cycles
- Volatility
- ZIGZAG
- MESA
- Retracement
- Aroon
INDICATORS LIST
LIST OF TOPICS
PRINT THIS ARTICLE
by David Penn
Time to party like it's 1982?
Position: N/A
David Penn
Technical Writer for Technical Analysis of STOCKS & COMMODITIES magazine, Working-Money.com, and Traders.com Advantage.
PRINT THIS ARTICLE
ELLIOTT WAVE
Cannons And Trumpets
07/21/06 11:27:14 AMby David Penn
Time to party like it's 1982?
Position: N/A
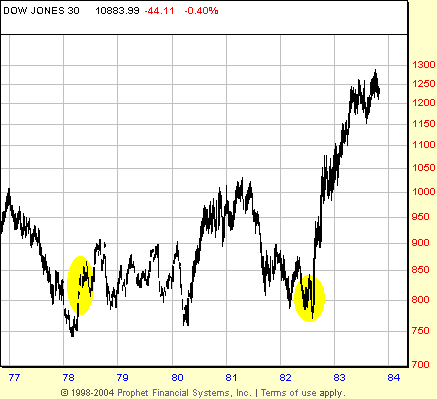
| Israel first invaded Lebanon in the spring of 1978 (and remained until the summer of that year). The second invasion of Lebanon, the one that led to the sustained occupation, occurred in the summer of 1982. These were years early in the secular bull market that began in 1974, part of what Elliotticians refer to as the second wave. Second waves are corrective waves in bull markets and, coming so shortly after the loathing that characterizes bear market bottoms, tend to have as much—or more—of the sort of social mood negativity associated with bottoms in the stock market. Here are how AJ Frost and Robert Prechter characterize second waves in their book, The Elliott Wave Principle: TEST OF LOWS |

|
| FIGURE 1: DOW JONES INDUSTRIAL AVERAGE, WEEKLY. The two highlighted ovals mark the dates of Israeli invasions of Lebanon. |
| Graphic provided by: Prophet Financial, Inc. |
| |
| For what it is worth, Israeli invasions into Lebanon have had an interesting coincidence with bottoms in the stock market (Figure 1). I'd argue that they are fundamentally bottoms in social mood that bring about bottoms in the stock market. But that's a conversation for another day. What I'm really after is the notion of "cannons and trumpets": namely, the cliché that savvy speculators buy to the sound of cannons and sell to the sound of trumpets. In other words, when war breaks out and everyone fears the worst, things often begin to improve. Conversely, when victory is declared and people begin to become complacent, smug, and satisfied with their accomplishments, things often begin to deteriorate. The end of the cyclical bear market from 2000 to the autumn of 2002–spring of 2003 is one large-scale example of the "cannons" half of the thesis. |
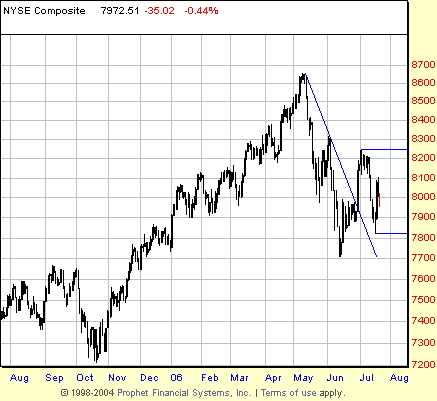
| I bring this up now as former US Speaker of the House Newt Gingrich observes that the onset of hostilities between Israel and Hezbollah signals the beginning of "World War III," and as others insist that the current crisis involving Israel, Hezbollah, and Lebanon is actually part of the wider crisis involving Syria and Iran. Even the critics of this view see the current crisis writ larger rather than smaller, invoking the US's troubled occupation/reconstruction of Iraq. The point is that it is little surprise that the American Association of Individual Investors (AAII) recently polled its members and revealed a level of bearishness not seen since the spring of 2003—a moment that coincided with the beginning of the US invasion of Iraq and of a strong, multiyear cyclical bull market that nearly brought new all-time highs to the Dow industrials. See Figure 2. |

|
| FIGURE 2: NEW YORK STOCK EXCHANGE, DAILY. A resolution of the break of the May–June downtrend line will help speculators determine whether a major low was established in mid-June. |
| Graphic provided by: Prophet Financial, Inc. |
| |
| This is occurring as the markets—as measured by the New York Stock Exchange—have fallen approximately 10% from their 2006, multiyear highs and remain above the last major low in October 2005 (the NASDAQ is another story, though the Russell 2000, perhaps a better indication of the performance of small stocks, looks significantly more like the NYSE than the NASDAQ at this point). Certainly, the current 10% correction could turn into a 15%, 20%, or even 30% correction. Certainly, this could be the beginning of something worse. |
| But it bears remembering that the markets will not move lower unless things do in fact get worse—and demonstrably so. A correction that was initially characterized, in social mood terms, by the rape/murder of an Iraqi girl by American soldiers will now be remembered for the outbreak of violence between Israel and Hezbollah forces within Lebanon. The markets are capable of moving lower, but they'll have to drag the rest of the world down with them. |
Technical Writer for Technical Analysis of STOCKS & COMMODITIES magazine, Working-Money.com, and Traders.com Advantage.
| Title: | Technical Writer |
| Company: | Technical Analysis, Inc. |
| Address: | 4757 California Avenue SW |
| Seattle, WA 98116 | |
| Phone # for sales: | 206 938 0570 |
| Fax: | 206 938 1307 |
| Website: | www.Traders.com |
| E-mail address: | DPenn@traders.com |
Traders' Resource Links | |
| Charting the Stock Market: The Wyckoff Method -- Books | |
| Working-Money.com -- Online Trading Services | |
| Traders.com Advantage -- Online Trading Services | |
| Technical Analysis of Stocks & Commodities -- Publications and Newsletters | |
| Working Money, at Working-Money.com -- Publications and Newsletters | |
| Traders.com Advantage -- Publications and Newsletters | |
| Professional Traders Starter Kit -- Software | |
Click here for more information about our publications!
Comments
Date: 07/22/06Rank: 3Comment:

|

Request Information From Our Sponsors
- StockCharts.com, Inc.
- Candle Patterns
- Candlestick Charting Explained
- Intermarket Technical Analysis
- John Murphy on Chart Analysis
- John Murphy's Chart Pattern Recognition
- John Murphy's Market Message
- MurphyExplainsMarketAnalysis-Intermarket Analysis
- MurphyExplainsMarketAnalysis-Visual Analysis
- StockCharts.com
- Technical Analysis of the Financial Markets
- The Visual Investor
- VectorVest, Inc.
- Executive Premier Workshop
- One-Day Options Course
- OptionsPro
- Retirement Income Workshop
- Sure-Fire Trading Systems (VectorVest, Inc.)
- Trading as a Business Workshop
- VectorVest 7 EOD
- VectorVest 7 RealTime/IntraDay
- VectorVest AutoTester
- VectorVest Educational Services
- VectorVest OnLine
- VectorVest Options Analyzer
- VectorVest ProGraphics v6.0
- VectorVest ProTrader 7
- VectorVest RealTime Derby Tool
- VectorVest Simulator
- VectorVest Variator
- VectorVest Watchdog
