HOT TOPICS LIST
- MACD
- Fibonacci
- RSI
- Gann
- ADXR
- Stochastics
- Volume
- Triangles
- Futures
- Cycles
- Volatility
- ZIGZAG
- MESA
- Retracement
- Aroon
INDICATORS LIST
LIST OF TOPICS
PRINT THIS ARTICLE
by David Penn
Car bombs in Iraq, nuclear profileration in Iran, airstrikes in Lebanon ... so why aren't these oil stocks smiling?
Position: N/A
David Penn
Technical Writer for Technical Analysis of STOCKS & COMMODITIES magazine, Working-Money.com, and Traders.com Advantage.
PRINT THIS ARTICLE
HEAD & SHOULDERS
A Head & Shoulders Top In Oil Service?
07/21/06 08:07:25 AMby David Penn
Car bombs in Iraq, nuclear profileration in Iran, airstrikes in Lebanon ... so why aren't these oil stocks smiling?
Position: N/A
| The bull market in oil service stocks has been in place for so long that it is hard to recall when these stocks weren't fawned over by retail and institutional traders alike. More to the point, the sector (as measured by the oil service HOLDRS, OIH) has not suffered a significant correction since the summer of 2002. |

|
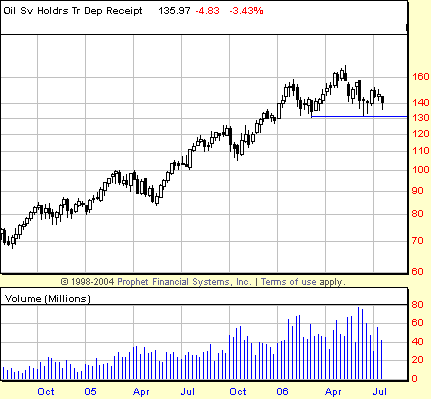
| FIGURE 1: OIL SERVICE HOLDRS, WEEKLY. Is the bounce out of the second-quarter lows in 2006 the start of a move higher, or merely the somewhat misshapen right shoulder of a head & shoulders top? |
| Graphic provided by: Prophet Financial, Inc. |
| |
| By "significant correction," I mean a correction that took out a previous correction low. Although there have been declines in the OIH—the second half of 2003, briefly in the spring of 2004, again in the spring of 2005—none of these corrections seriously imperiled the longer-term uptrend by closing beneath the low point established in a prior correction. This is a true sign of strength in a trending market. |
| The year 2006 has seen the oil stocks in their longest consolidation since 2003, when the group rose into the midpoint of the year and sank during the second half, leaving the OIH more or less flat for the year. The question at present is whether the growing consolidation in 2006 will have the same sort of bullish resolution that the correction of 2003 did (the OIH caught a bid very late in the year and soared into 2004). |

|
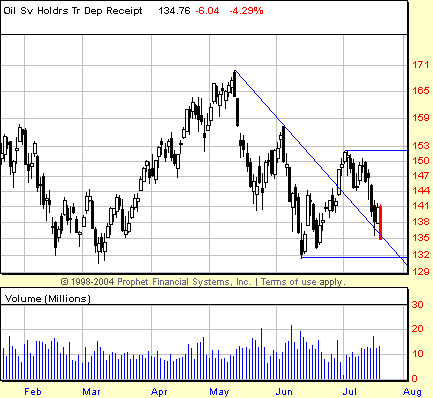
| FIGURE 2: OIL SERVICE HOLDRS, DAILY. The OIH struggles to reverse the downtrend that began in May. Failing to take out the June highs during the bounce in the second half of the month, the OIH now looks poised to test the June lows. |
| Graphic provided by: Prophet Financial, Inc. |
| |
| Right now, the OIH appears to be adopting many of the characteristics of a top, a head & shoulders top, to be specific. As Figure 1 shows, a head & shoulders top would require a breakdown below the support provided by the neckline at approximately 130. The lower shadows on the weekly candlesticks late in the second quarter (roughly May–June) hint that such a downside break would have to be a violent one, insofar as the shadows suggest that the bulls were able to maintain their strength as the week's drew to a close, pushing the OIH back up away from the lows. So it seems to me that it will take a particularly negative week or set of weeks to smash below the oft-tested, not-yet-broken support indicated by the weekly candlesticks. |
| Zooming in for a closer look at the OIH, we can see a 1-2-3 trend reversal process under way. Bouncing from the June lows (Figure 2), the OIH broke out above its downtrend line late in the month, establishing a stage 1 resistance level. Falling away from that resistance level near 152, the OIH is rapidly moving through stage 2—the effort to reassert the previous trend. Confirmation that the previous trend (which was downward) has been reestablished would come if the OIH was able to close below the June lows and show some additional follow-through to the downside (the latter to avoid a potential 2B bounce.) |
Technical Writer for Technical Analysis of STOCKS & COMMODITIES magazine, Working-Money.com, and Traders.com Advantage.
| Title: | Technical Writer |
| Company: | Technical Analysis, Inc. |
| Address: | 4757 California Avenue SW |
| Seattle, WA 98116 | |
| Phone # for sales: | 206 938 0570 |
| Fax: | 206 938 1307 |
| Website: | www.Traders.com |
| E-mail address: | DPenn@traders.com |
Traders' Resource Links | |
| Charting the Stock Market: The Wyckoff Method -- Books | |
| Working-Money.com -- Online Trading Services | |
| Traders.com Advantage -- Online Trading Services | |
| Technical Analysis of Stocks & Commodities -- Publications and Newsletters | |
| Working Money, at Working-Money.com -- Publications and Newsletters | |
| Traders.com Advantage -- Publications and Newsletters | |
| Professional Traders Starter Kit -- Software | |
Click here for more information about our publications!
Comments
Date: 07/22/06Rank: 3Comment:

Request Information From Our Sponsors
- StockCharts.com, Inc.
- Candle Patterns
- Candlestick Charting Explained
- Intermarket Technical Analysis
- John Murphy on Chart Analysis
- John Murphy's Chart Pattern Recognition
- John Murphy's Market Message
- MurphyExplainsMarketAnalysis-Intermarket Analysis
- MurphyExplainsMarketAnalysis-Visual Analysis
- StockCharts.com
- Technical Analysis of the Financial Markets
- The Visual Investor
- VectorVest, Inc.
- Executive Premier Workshop
- One-Day Options Course
- OptionsPro
- Retirement Income Workshop
- Sure-Fire Trading Systems (VectorVest, Inc.)
- Trading as a Business Workshop
- VectorVest 7 EOD
- VectorVest 7 RealTime/IntraDay
- VectorVest AutoTester
- VectorVest Educational Services
- VectorVest OnLine
- VectorVest Options Analyzer
- VectorVest ProGraphics v6.0
- VectorVest ProTrader 7
- VectorVest RealTime Derby Tool
- VectorVest Simulator
- VectorVest Variator
- VectorVest Watchdog
