HOT TOPICS LIST
- MACD
- Fibonacci
- RSI
- Gann
- ADXR
- Stochastics
- Volume
- Triangles
- Futures
- Cycles
- Volatility
- ZIGZAG
- MESA
- Retracement
- Aroon
INDICATORS LIST
LIST OF TOPICS
PRINT THIS ARTICLE
by David Penn
Take a look at the mid-June bounce in December gold.
Position: N/A
David Penn
Technical Writer for Technical Analysis of STOCKS & COMMODITIES magazine, Working-Money.com, and Traders.com Advantage.
PRINT THIS ARTICLE
HEAD & SHOULDERS
The Golden Pullback
07/20/06 07:51:03 AMby David Penn
Take a look at the mid-June bounce in December gold.
Position: N/A
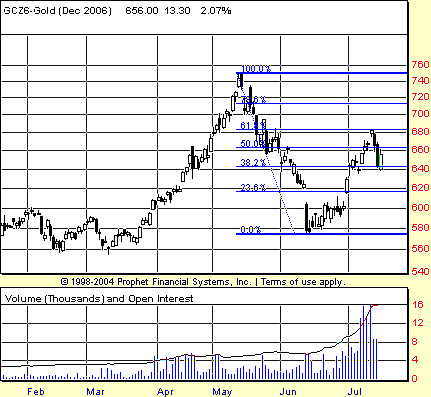
| Gold topped out in May 2006, along with most of the stock market. The correction that followed took gold from near $750 (basis December) to just under $580 in about a month. As sharp as the correction was, it did not take out any significant previous lows. This no doubt provides gold bulls with a measure of hope that the correction will be remembered as a buying opportunity rather than the beginning of a much more severe downturn. The bounce from the mid-June lows retraced a Fibonacci 61.8% of the previous decline. In fact, it was almost a picture-perfect bounce from the Fibonacci perspective (Figure 1). |

|
| FIGURE 1: DECEMBER GOLD, DAILY. The bounce that began in mid-June helped gold retrace fully 61.8% of its decline from the May peak. |
| Graphic provided by: Prophet Financial, Inc. |
| |
| A retracement that finds resistance at the 61.8% level tends to bring out a certain amount of panic in those who are long that particular market. Such events tend to bring to mind what an old biochemistry professor of mine used to say at the end of every lecture: "This would be a good place to stop." And sure enough, the market reversed fairly dramatically from that resistance level, falling from just over 680 to about 640 in a matter of days. |
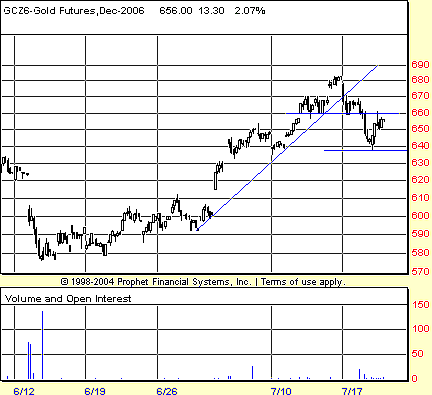
| The hourly chart provides some interesting insights to what happened when December gold ran into the 61.8% resistance level. Figure 2 shows the hourly chart of December gold, with a best-case trendline that begins about 10 points off the true lows. I consider this a "best-case" trendline because a trendline that uses the true lows as its point of origin would be pretty useless, insofar as there would be only one point of contact to confirm the trendline. Note how late in the rally, the market appears to develop a short-term (this is an hourly chart, after all) head & shoulders top. Like the Fibonacci retracement mentioned previously, this head & shoulders top is also almost perfectly formed. The left shoulder is approximately 10 points high, the right shoulder only slightly smaller, and the head of the formation is just a bit more than 20 points high. With a formation high of about 680 and a neckline of 660, traders could expect a minimum decline to the 640 level. |

|
| FIGURE 2: DECEMBER GOLD, HOURLY. A head & shoulders top in mid-July set the stage for a trendline break and a pullback in the month-long advance. |
| Graphic provided by: Prophet Financial, Inc. |
| |
| The break below the support of the neckline was sharp and deep, as December gold lost more than 10 points in a single, breakdown hour. Three hours afterward, GCZ6 had reached its minimum price objective of 640, but only on an intrabar (or, rather, intracandlestick) basis. That, combined with the fact that 640 was a minimum objective, puts the bounce in gold that came shortly afterward in perspective. |
| It is also worth looking at this short-term head & shoulders breakdown as part of a larger 1-2-3 trend reversal setup. This is especially the case if December gold moves up above neckline support-turned-resistance at 660. As far as the 1-2-3 trend reversal goes, gold appears to have completed the first stage of that reversal—namely, the trendline break and initial countertrend limit. If the head & shoulders top is NOT valid, then gold should move higher to test the 680 level, forming the second stage of the 1-2-3 trend reversal (the third stage would be a failure to set a new high and a move back below the initial countertrend limit at 640). |
Technical Writer for Technical Analysis of STOCKS & COMMODITIES magazine, Working-Money.com, and Traders.com Advantage.
| Title: | Technical Writer |
| Company: | Technical Analysis, Inc. |
| Address: | 4757 California Avenue SW |
| Seattle, WA 98116 | |
| Phone # for sales: | 206 938 0570 |
| Fax: | 206 938 1307 |
| Website: | www.Traders.com |
| E-mail address: | DPenn@traders.com |
Traders' Resource Links | |
| Charting the Stock Market: The Wyckoff Method -- Books | |
| Working-Money.com -- Online Trading Services | |
| Traders.com Advantage -- Online Trading Services | |
| Technical Analysis of Stocks & Commodities -- Publications and Newsletters | |
| Working Money, at Working-Money.com -- Publications and Newsletters | |
| Traders.com Advantage -- Publications and Newsletters | |
| Professional Traders Starter Kit -- Software | |
Click here for more information about our publications!
Comments
Date: 07/22/06Rank: 3Comment:

Request Information From Our Sponsors
- StockCharts.com, Inc.
- Candle Patterns
- Candlestick Charting Explained
- Intermarket Technical Analysis
- John Murphy on Chart Analysis
- John Murphy's Chart Pattern Recognition
- John Murphy's Market Message
- MurphyExplainsMarketAnalysis-Intermarket Analysis
- MurphyExplainsMarketAnalysis-Visual Analysis
- StockCharts.com
- Technical Analysis of the Financial Markets
- The Visual Investor
- VectorVest, Inc.
- Executive Premier Workshop
- One-Day Options Course
- OptionsPro
- Retirement Income Workshop
- Sure-Fire Trading Systems (VectorVest, Inc.)
- Trading as a Business Workshop
- VectorVest 7 EOD
- VectorVest 7 RealTime/IntraDay
- VectorVest AutoTester
- VectorVest Educational Services
- VectorVest OnLine
- VectorVest Options Analyzer
- VectorVest ProGraphics v6.0
- VectorVest ProTrader 7
- VectorVest RealTime Derby Tool
- VectorVest Simulator
- VectorVest Variator
- VectorVest Watchdog
