HOT TOPICS LIST
- MACD
- Fibonacci
- RSI
- Gann
- ADXR
- Stochastics
- Volume
- Triangles
- Futures
- Cycles
- Volatility
- ZIGZAG
- MESA
- Retracement
- Aroon
INDICATORS LIST
LIST OF TOPICS
PRINT THIS ARTICLE
by David Penn
Here's a look at the S&P 500 since the May peak, by way of Sperandeo's 1-2-3 trend reversal.
Position: N/A
David Penn
Technical Writer for Technical Analysis of STOCKS & COMMODITIES magazine, Working-Money.com, and Traders.com Advantage.
PRINT THIS ARTICLE
REVERSAL
Tests And Trendlines
07/19/06 08:19:02 AMby David Penn
Here's a look at the S&P 500 since the May peak, by way of Sperandeo's 1-2-3 trend reversal.
Position: N/A
| I found myself in an interesting conversation with a colleague here in the office the other day. This colleague is an excellent technician, with a particularly good grasp of trading systems and indicators. But for years he has been a big fan of Gary B. Smith, formerly of TheStreet.com. Why the "but"? Because unlike my colleague, Smith is notorious for eschewing trading systems and indicators, preferring instead the simplicity of trendlines, support and resistance, and volume. |

|
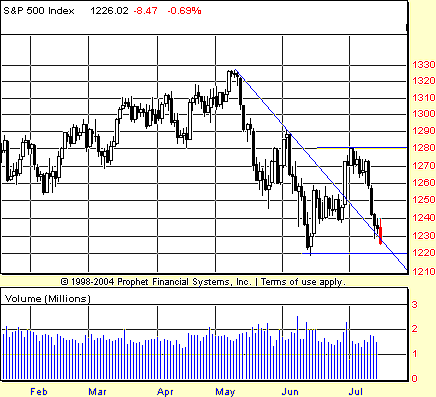
| FIGURE 1: S&P 500, DAILY. The breaking of the downtrend in late June led to the demarcation of a resistance level at 1280 in early July. Retreating from that resistance level, the S&P 500 swoons toward a test of support at the lows of the May–June correction near 1220. |
| Graphic provided by: Prophet Financial, Inc. |
| |
| In my mind, every indicator-using technician needs to come to grips with their own inner Gary Smith. As fun as indicators and systems are, I don't doubt for a second that most technicians would love to be able to thoroughly analyze price and volume charts with little more than a straightedge and a #2 pencil. |
| To that end, I wanted to take a look at the decline in the Standard & Poor's 500 that began in May through my Gary Smith glasses. Actually, the spectacles I'll be deploying are those of Victor Sperandeo who, in his books Trader Vic: Methods Of A Wall Street Master and Trader Vic II: Principles Of Professional Speculation, points out a technique involving simple trendlines and support/resistance lines in order to make sense of markets when indicators and other technical tools seem to obscure rather than reveal. |

|
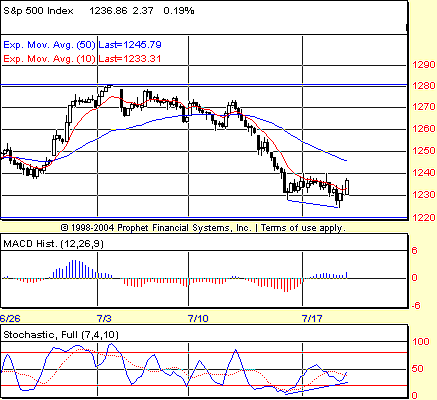
| FIGURE 2: S&P 500, HOURLY. A positive divergence in the stochastic of the hourly S&P 500 accompanies this test of the June lows. |
| Graphic provided by: Prophet Financial, Inc. |
| |
| Let's look at the known knowns, as US Defense Secretary Donald Rumsfeld might say. The S&P 500 made a significant peak in May 2006. What followed was a correction that took out several previous minor lows going back to November 2005. Shown in Figure 1 is a trendline that connects the May 2006 high with the highest high immediately before the lowest low (that "highest high" being the June 2006 highs). This is the key trendline of the decline, and the violation of that trendline in late June was a significant event. Just how significant remains to be seen. But the market breaking out above that trendline established the "1" of the 1-2-3 trend reversal setup that Sperandeo wrote about. In fact, the "1" is at 1280, the maximum extent of the countertrend move from mid-June to early July. |
| Failure at 1280 and the subsequent reversal to the downside set up the "2" of the 1-2-3 trend reversal--namely, the effort to reassert the downtrend and set a new low. The low of the May-June decline just south of 1220 is another key level. Violating that level to the downside would reaffirm the validity of the downtrend and suggest that further declines were likely. The next phase of the 1-2-3 trend reversal, the "3," is the breakout beyond the limit established by "1." In other words, a successful trend reversal will require the S&P 500 to move above 1280 (Figure 2). |
Technical Writer for Technical Analysis of STOCKS & COMMODITIES magazine, Working-Money.com, and Traders.com Advantage.
| Title: | Technical Writer |
| Company: | Technical Analysis, Inc. |
| Address: | 4757 California Avenue SW |
| Seattle, WA 98116 | |
| Phone # for sales: | 206 938 0570 |
| Fax: | 206 938 1307 |
| Website: | www.Traders.com |
| E-mail address: | DPenn@traders.com |
Traders' Resource Links | |
| Charting the Stock Market: The Wyckoff Method -- Books | |
| Working-Money.com -- Online Trading Services | |
| Traders.com Advantage -- Online Trading Services | |
| Technical Analysis of Stocks & Commodities -- Publications and Newsletters | |
| Working Money, at Working-Money.com -- Publications and Newsletters | |
| Traders.com Advantage -- Publications and Newsletters | |
| Professional Traders Starter Kit -- Software | |
Click here for more information about our publications!
PRINT THIS ARTICLE

Request Information From Our Sponsors
- StockCharts.com, Inc.
- Candle Patterns
- Candlestick Charting Explained
- Intermarket Technical Analysis
- John Murphy on Chart Analysis
- John Murphy's Chart Pattern Recognition
- John Murphy's Market Message
- MurphyExplainsMarketAnalysis-Intermarket Analysis
- MurphyExplainsMarketAnalysis-Visual Analysis
- StockCharts.com
- Technical Analysis of the Financial Markets
- The Visual Investor
- VectorVest, Inc.
- Executive Premier Workshop
- One-Day Options Course
- OptionsPro
- Retirement Income Workshop
- Sure-Fire Trading Systems (VectorVest, Inc.)
- Trading as a Business Workshop
- VectorVest 7 EOD
- VectorVest 7 RealTime/IntraDay
- VectorVest AutoTester
- VectorVest Educational Services
- VectorVest OnLine
- VectorVest Options Analyzer
- VectorVest ProGraphics v6.0
- VectorVest ProTrader 7
- VectorVest RealTime Derby Tool
- VectorVest Simulator
- VectorVest Variator
- VectorVest Watchdog
