HOT TOPICS LIST
- MACD
- Fibonacci
- RSI
- Gann
- ADXR
- Stochastics
- Volume
- Triangles
- Futures
- Cycles
- Volatility
- ZIGZAG
- MESA
- Retracement
- Aroon
INDICATORS LIST
LIST OF TOPICS
PRINT THIS ARTICLE
by Luis Ferro
The formation of the reversal candlestick evening star pattern has probably brought JCI's short-term uptrend to an end, while in the medium term, the breakdown below a major support/resistance level can lead to the formation of a head & shoulders pattern.
Position: Sell
Luis Ferro
Trader and technical analyst living in Bern, Switzerland. A full member of the STA, currently enrolled in the DITA program and the CMT program.
PRINT THIS ARTICLE
CANDLESTICK CHARTING
Evening Star For JCI
07/17/06 08:56:51 AMby Luis Ferro
The formation of the reversal candlestick evening star pattern has probably brought JCI's short-term uptrend to an end, while in the medium term, the breakdown below a major support/resistance level can lead to the formation of a head & shoulders pattern.
Position: Sell
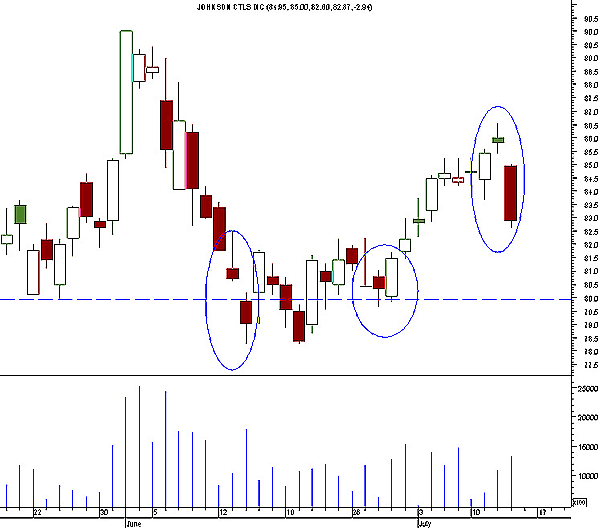
| The daily candlestick chart (Figure 1) of Johnson Controls (JCI) shows the price action of the last eight to 10 weeks. Following a high of 90 on June 1, JCI initiated a corrective movement. On June 13, an inverted hammer was formed, which was the first signal that the correction could be ending. Inverted hammers, just like the normal hammer, can be either bearish, if they are formed after an uptrend, or bullish if they appear following a downtrend, as in this case. On the next day, prices gapped down. Because of the context in which the gap was formed, it could be either a continuation or an exhaustion gap. The gap was closed on the following day, confirming that it was probably an exhaustion gap (continuation gaps usually don't close for some time), and that the short-term downtrend had probably ended. Indeed, prices entered a congestion area following this event. On June 29 (marked with a blue circle on the chart), a bullish engulfing pattern occurred. The close of the second day was very near the high and the volume was the highest since the previous 10 days, and even though the body of the second day wasn't particularly large, it still engulfed the previous day's body. The short-term uptrend that started with the bullish engulfing took prices to 86.54. However, on the last trading session, a bearish evening star pattern was completed, and chances are that the short-term trend will again change and prices will fall. |

|
| FIGURE 1: JOHNSON CONTROLS, DAILY. This candlestick chart shows important technical events. |
| Graphic provided by: MetaStock. |
| |
| Stars are some of the most interesting and powerful candlestick reversal patterns. They are formed at the end of a trend and are composed of three candles. In the case of an evening star, the first candle should have a long green body. On the second day, prices should gap up and the real body must be relatively small. On the third day, there should be a gap once more, but this time down, the candle should have a long red body, with prices closing at or near the low for the day. This is the ideal evening star pattern, but in real markets, there should always be room for some flexibility when applying candlesticks (or any other techniques) to actual trading situations. In the case of JCI, the first day did not have a particularly long green body, but the close was very near the top. On the second day, the body was very small, almost a doji, but there was no gap. However, the second body did not overlap the first day's body, and that is sufficient for a star pattern. Finally, the third day was a textbook example, with a clear gap and a strong, long red body that closed very near the low for the day. The case for a short-term downtrend is strong. However, before trading in the short term, it is essential to analyze the medium- and long-term trend to try to determine possible factors that might affect the risk or reward of a possible trade. |

|
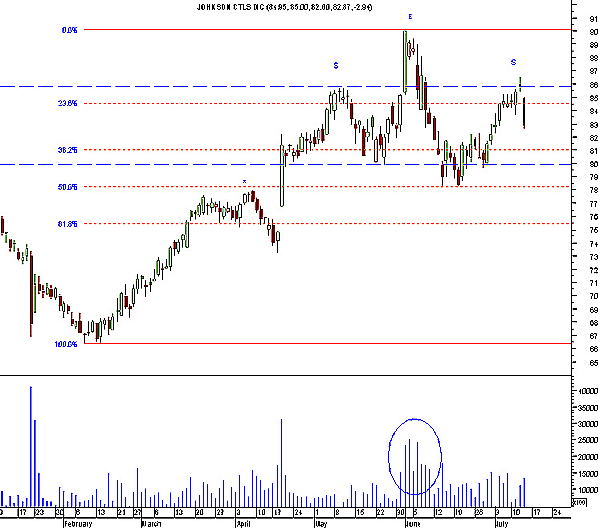
| FIGURE 2: JOHNSON CONTROLS, DAILY. This longer-term daily candlestick chart with Fibonacci retracement levels shows the head & shoulders pattern. |
| Graphic provided by: MetaStock. |
| |
| In the longer-term chart (Figure 2), it is easy to see why the first correction following the top ended at 78.28. This was a previous support/resistance level (marked with a blue arrow) that coincided with the important 50% Fibonacci retracement level. When two or more different types of support/resistance occur at the same level, the chances that the trend will stop increase substantially. The evening star was also formed at a previous resistance level (the dotted blue line). It is important to note that if prices fall in the short term, then a head & shoulders pattern can be formed. This pattern is extremely reliable, and if it is completed, it will have bearish implications for the medium- and long-term trend. Volume peaked during the head of the head & shoulders, which is normal, but continued strong in the next few days, even though prices were already falling. Strong volume with falling prices or even during congestion phases are a sign of distribution and a major weakness warning. However, it will probably not be easy for Johnson Controls (JCI) to complete the head & shoulders pattern, due to the combined effect of the previous support and the 50% Fibonacci retracement, and prices can very well enter a medium-term congestion area. In this case, the longer-term analysis does not invalidate the bearish forecast that was derived from the evening star, but merely points out several obstacles that can stop the progression of a future downtrend. |
Trader and technical analyst living in Bern, Switzerland. A full member of the STA, currently enrolled in the DITA program and the CMT program.
| Address: | Switzerland |
| E-mail address: | luispgsf@yahoo.com |
Click here for more information about our publications!
PRINT THIS ARTICLE

Request Information From Our Sponsors
- VectorVest, Inc.
- Executive Premier Workshop
- One-Day Options Course
- OptionsPro
- Retirement Income Workshop
- Sure-Fire Trading Systems (VectorVest, Inc.)
- Trading as a Business Workshop
- VectorVest 7 EOD
- VectorVest 7 RealTime/IntraDay
- VectorVest AutoTester
- VectorVest Educational Services
- VectorVest OnLine
- VectorVest Options Analyzer
- VectorVest ProGraphics v6.0
- VectorVest ProTrader 7
- VectorVest RealTime Derby Tool
- VectorVest Simulator
- VectorVest Variator
- VectorVest Watchdog
- StockCharts.com, Inc.
- Candle Patterns
- Candlestick Charting Explained
- Intermarket Technical Analysis
- John Murphy on Chart Analysis
- John Murphy's Chart Pattern Recognition
- John Murphy's Market Message
- MurphyExplainsMarketAnalysis-Intermarket Analysis
- MurphyExplainsMarketAnalysis-Visual Analysis
- StockCharts.com
- Technical Analysis of the Financial Markets
- The Visual Investor
