HOT TOPICS LIST
- MACD
- Fibonacci
- RSI
- Gann
- ADXR
- Stochastics
- Volume
- Triangles
- Futures
- Cycles
- Volatility
- ZIGZAG
- MESA
- Retracement
- Aroon
INDICATORS LIST
LIST OF TOPICS
PRINT THIS ARTICLE
by Arthur Hill
After a long consolidation, KLA Tencor formed a big bullish engulfing at support, and follow-through above resistance would confirm this pattern.
Position: Hold
Arthur Hill
Arthur Hill is currently editor of TDTrader.com, a website specializing in trading strategies, sector/industry specific breadth stats and overall technical analysis. He passed the Society of Technical Analysts (STA London) diploma exam with distinction is a Certified Financial Technician (CFTe). Prior to TD Trader, he was the Chief Technical Analyst for Stockcharts.com and the main contributor to the ChartSchool.
PRINT THIS ARTICLE
CANDLESTICK CHARTING
KLA Tencor Forms Big Engulfing Pattern
07/17/06 10:48:59 AMby Arthur Hill
After a long consolidation, KLA Tencor formed a big bullish engulfing at support, and follow-through above resistance would confirm this pattern.
Position: Hold
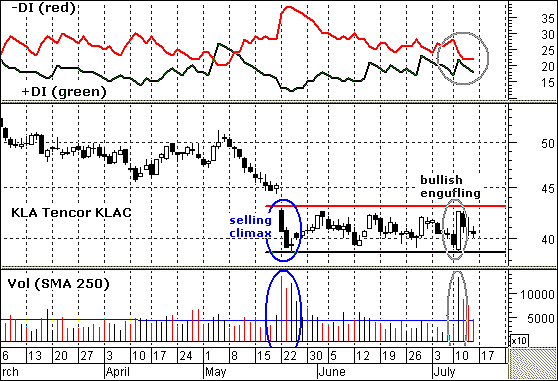
| KLA Tencor (KLAC) led the market lower in early May and then firmed from mid-May until mid-July (Figure 1). The NASDAQ moved lower over this time frame, and the ability to hold support is positive for KLAC. This shows relative strength and the stock is actually outperforming the NASDAQ. However, the stock needs to break free of its trading range to show some absolute strength and open the door to higher prices. |

|
| FIGURE 1: KLAC. KLA Tencor led the market lower in May and then firmed from mid-May to mid-July. |
| Graphic provided by: MetaStock. |
| |
| A trading range formed over the last two months with support around 39 and resistance around 43. A selling climax in mid-May (blue ovals) and a bullish engulfing pattern in mid-July confirm support (gray ovals). Both occurred on high volume, and this further reinforces the importance of support. A break below 39 would clear the way to new lows, while a break above 43 would target a run to the next resistance zone just around 50. |
| The bears have the edge as long as -DI holds above +DI. Plus directional movement (+DI) is part of J. Welles Wilder's average directional movement index (ADX), and this reflects the strength of advances. Similarly, minus directional movement (-DI) reflects the strength of declines. The stock declined sharply in May, and +DI has yet to recover. +DI moved below -DI on May 10 and has been below ever since. A break above -DI and above 30 would be bullish for this indicator and could be used to confirm the breakout in the stock. |
Arthur Hill is currently editor of TDTrader.com, a website specializing in trading strategies, sector/industry specific breadth stats and overall technical analysis. He passed the Society of Technical Analysts (STA London) diploma exam with distinction is a Certified Financial Technician (CFTe). Prior to TD Trader, he was the Chief Technical Analyst for Stockcharts.com and the main contributor to the ChartSchool.
| Title: | Editor |
| Company: | TDTrader.com |
| Address: | Willem Geetsstraat 17 |
| Mechelen, B2800 | |
| Phone # for sales: | 3215345465 |
| Website: | www.tdtrader.com |
| E-mail address: | arthurh@tdtrader.com |
Traders' Resource Links | |
| TDTrader.com has not added any product or service information to TRADERS' RESOURCE. | |
Click here for more information about our publications!
Comments
Date: 07/18/06Rank: 4Comment:

Request Information From Our Sponsors
- VectorVest, Inc.
- Executive Premier Workshop
- One-Day Options Course
- OptionsPro
- Retirement Income Workshop
- Sure-Fire Trading Systems (VectorVest, Inc.)
- Trading as a Business Workshop
- VectorVest 7 EOD
- VectorVest 7 RealTime/IntraDay
- VectorVest AutoTester
- VectorVest Educational Services
- VectorVest OnLine
- VectorVest Options Analyzer
- VectorVest ProGraphics v6.0
- VectorVest ProTrader 7
- VectorVest RealTime Derby Tool
- VectorVest Simulator
- VectorVest Variator
- VectorVest Watchdog
- StockCharts.com, Inc.
- Candle Patterns
- Candlestick Charting Explained
- Intermarket Technical Analysis
- John Murphy on Chart Analysis
- John Murphy's Chart Pattern Recognition
- John Murphy's Market Message
- MurphyExplainsMarketAnalysis-Intermarket Analysis
- MurphyExplainsMarketAnalysis-Visual Analysis
- StockCharts.com
- Technical Analysis of the Financial Markets
- The Visual Investor
