HOT TOPICS LIST
- MACD
- Fibonacci
- RSI
- Gann
- ADXR
- Stochastics
- Volume
- Triangles
- Futures
- Cycles
- Volatility
- ZIGZAG
- MESA
- Retracement
- Aroon
INDICATORS LIST
LIST OF TOPICS
PRINT THIS ARTICLE
by Koos van der Merwe
How accurate and consistent is the four-year cycle? Judge for yourself.
Position: Sell
Koos van der Merwe
Has been a technical analyst since 1969, and has worked as a futures and options trader with First Financial Futures in Johannesburg, South Africa.
PRINT THIS ARTICLE
CYCLES
The Four-Year Cycle
07/12/06 12:19:53 PMby Koos van der Merwe
How accurate and consistent is the four-year cycle? Judge for yourself.
Position: Sell
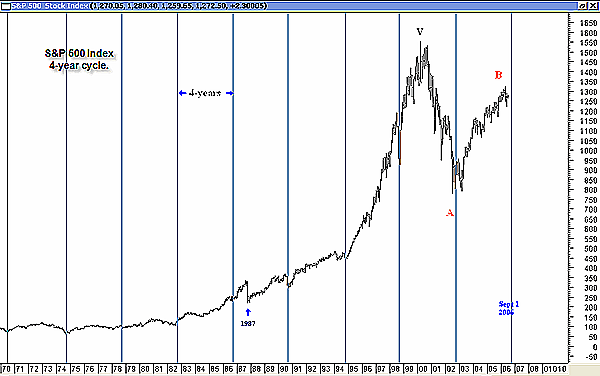
| One of the most reliable economic cycles over the past 70-odd years is the four-year cycle. All cycle enthusiasts, whether a student of delta or simply applying their favorite technical program's cycle indicator, will soon identify this cycle. We can quickly see that as each cycle ends, the market provides us with a buying opportunity. Of course, 1987 proved to be an exception, where a low was made that was out of kilter, but in most cases, the four-year cycle was intact (Figure 1). |

|
| FIGURE 1: S&P 500. Here's the four-year cycle of the S&P 500 index. |
| Graphic provided by: MetaStock. |
| |
| With this in mind, and projecting the cycle forward, we can ask whether this means that we should stay out of the market until September 2006, the next four-year cycle low. It looks like it. Market history has shown us that September is usually the quietest month of the year, and October is the month of crashes. If the cycle is out by one month, as is very, very probable, then we could expect the four-year cycle low to occur anytime from September to October 2006. |
| Does this cycle low and the ensuing buying opportunity present a distortion to the wave count that has become an acceptable sign to the direction of the market? Not necessarily. The cycle low could suggest the low of a wave 1 in a wave C down. The cycle also suggests that the end of the wave C would be in the later months of 2010 rather than in 2012, as forecast by Gann cycles and the K wave (see my article, "The Elusive B-Wave Of The S&P Index," Traders .com Advantage, May 4, 2006). |
| A simple four-year cycle of the Standard & Poor's 500 is suggesting an opportunity to close positions ahead of the anticipated meltdown as the market strengthens after the cycle low. Of course, this is assuming that all technical charts suggesting the meltdown are correct. If wrong, then we would lose future profits only, but if correct, we are protecting capital, and that is what counts. |
Has been a technical analyst since 1969, and has worked as a futures and options trader with First Financial Futures in Johannesburg, South Africa.
| Address: | 3256 West 24th Ave |
| Vancouver, BC | |
| Phone # for sales: | 6042634214 |
| E-mail address: | petroosp@gmail.com |
Click here for more information about our publications!
Comments
Date: 07/15/06Rank: 4Comment:
Date: 07/18/06Rank: 3Comment:

Request Information From Our Sponsors
- StockCharts.com, Inc.
- Candle Patterns
- Candlestick Charting Explained
- Intermarket Technical Analysis
- John Murphy on Chart Analysis
- John Murphy's Chart Pattern Recognition
- John Murphy's Market Message
- MurphyExplainsMarketAnalysis-Intermarket Analysis
- MurphyExplainsMarketAnalysis-Visual Analysis
- StockCharts.com
- Technical Analysis of the Financial Markets
- The Visual Investor
- VectorVest, Inc.
- Executive Premier Workshop
- One-Day Options Course
- OptionsPro
- Retirement Income Workshop
- Sure-Fire Trading Systems (VectorVest, Inc.)
- Trading as a Business Workshop
- VectorVest 7 EOD
- VectorVest 7 RealTime/IntraDay
- VectorVest AutoTester
- VectorVest Educational Services
- VectorVest OnLine
- VectorVest Options Analyzer
- VectorVest ProGraphics v6.0
- VectorVest ProTrader 7
- VectorVest RealTime Derby Tool
- VectorVest Simulator
- VectorVest Variator
- VectorVest Watchdog
