HOT TOPICS LIST
- MACD
- Fibonacci
- RSI
- Gann
- ADXR
- Stochastics
- Volume
- Triangles
- Futures
- Cycles
- Volatility
- ZIGZAG
- MESA
- Retracement
- Aroon
INDICATORS LIST
LIST OF TOPICS
PRINT THIS ARTICLE
by Luis Ferro
The size and other characteristics of this candlestick have bearish implications, but the level and overall context increase the chances of lower prices for coffee.
Position: Sell
Luis Ferro
Trader and technical analyst living in Bern, Switzerland. A full member of the STA, currently enrolled in the DITA program and the CMT program.
PRINT THIS ARTICLE
CANDLESTICK CHARTING
Strong Bearish Candle For Coffee
07/12/06 08:19:08 AMby Luis Ferro
The size and other characteristics of this candlestick have bearish implications, but the level and overall context increase the chances of lower prices for coffee.
Position: Sell
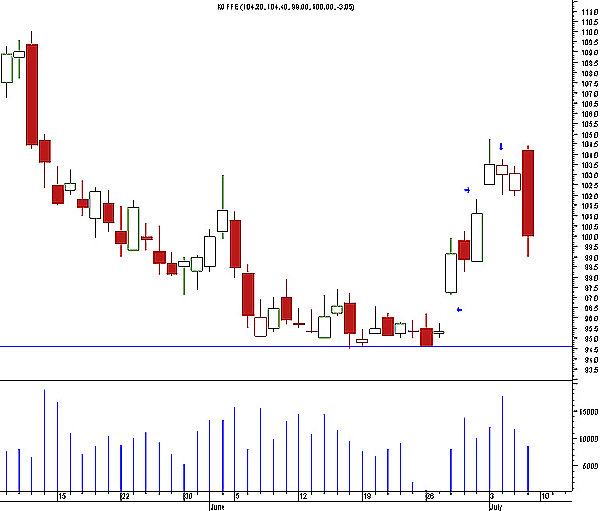
| On the last trading day, a long red candlestick formed. A glance at the medium-term trend supports a bearish forecast, while in the long trend, prices still need to break below a key level before a head & shoulders pattern is completed. The daily chart shows coffee's short-term trend (Figure 1). The congestion that occurred at the beginning of June ended when a breakaway gap was formed, and the short-term uptrend that followed brought prices to a high of 104.75. That same day a gap occurred, and two factors suggested that this could be an exhaustion gap. The first factor was the position in which the gap occurred, at the same level of the previous high at 103. The second was the fact that on the day of the gap, prices opened strong, but then reversed and closed in the lower half of the day's range. On the following day, a hanging man occurred. This candle pattern forms when the lower shadow is at least twice as big as the body and the upper shadow is either nonexistent or very small. It can be either bearish or bullish, depending on where it is formed. If it appears after a downtrend it is considered bullish and is called a hammer, but if it forms following an uptrend, as in this case, it is considered bearish. |

|
| FIGURE 1: COFFEE, DAILY. This candlestick chart indicates that there are gaps and a hanging man candle pattern marked with arrows. |
| Graphic provided by: MetaStock. |
| |
| Both signals were confirmed when, on the last trading day, coffee opened above the previous day's high but quickly turned and closed significantly lower. This day was a strong range expansion day that engulfed the three previous days and also closed the exhaustion gap. These are both strong bearish signals that suggest that a short-term downtrend has begun. The only weakness of the day, from a bearish forecasting point of view, is that volume was not very high. Nevertheless, it looks as though prices will indeed fall in the short term. |

|
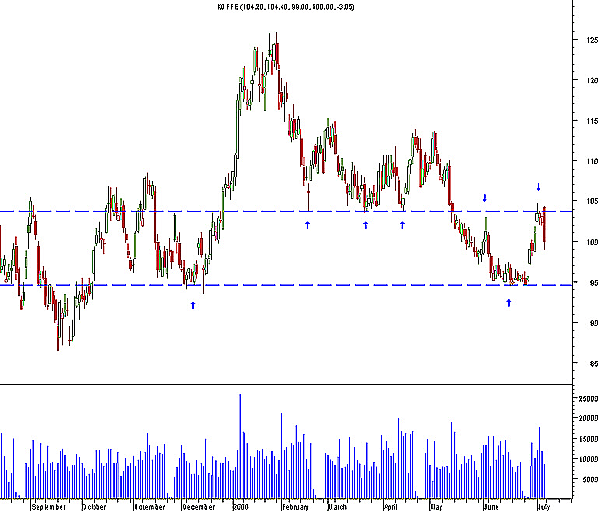
| FIGURE 2: COFFEE, DAILY. Here's a longer-term daily candlestick pattern showing the support/resistance levels. |
| Graphic provided by: MetaStock. |
| |
| With this next chart (Figure 2), it is possible to analyze the price action of coffee in the last six to nine months. After reaching a high of 125.9 in January, coffee initiated a strong correction, bringing prices to 103.8 at the beginning of February. A long congestion followed, and on two occasions, coffee tested the low at 103.8–104, but the support level withstood on both occasions. Finally, on the third attempt in May, prices fell below 103.8–104 and went down to 95 (which was itself a previous support level). It is very common for prices to pull back to the support level after the break, which now should act as resistance, a phenomenon referred to as role reversal in technical analysis. That is precisely what happened in this case, and it is easy to see the strong rejection that occurred in the form of the bearish expansion day when coffee tried to break above the 104 level. This suggests that in the medium term, coffee will probably correct further (since the support and resistance level has been tested and has withstood) and could break below the next support at 95. |

|
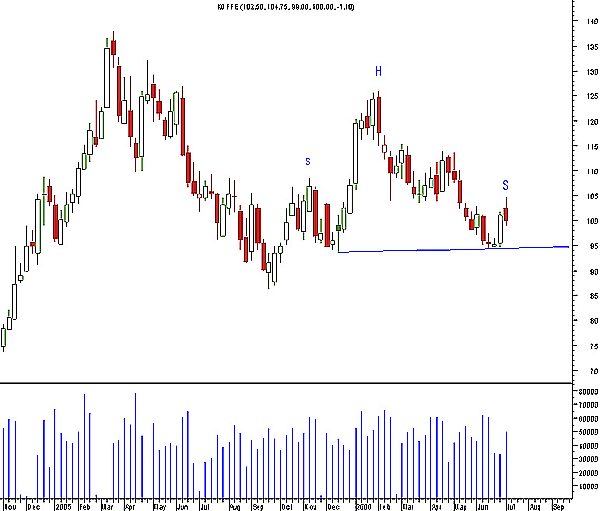
| FIGURE 3: COFFEE, WEEKLY. This chart shows the head & shoulders. |
| Graphic provided by: MetaStock. |
| |
| It is interesting how something that is essentially a short-term occurrence, the bearish expansion day, can have an impact well beyond the short-term trend. The possibility that prices will fall in the short term is high, and if the support level at 95 will not hold, then a head & shoulders pattern will be completed (Figure 3). This will also have strong bearish implications, but this time on the long term. This is a case in which the three trends are almost pointing in the same direction (only the long-term trend needs the head & shoulders to be completed), and these are generally the trades with the lowest risk and the highest rewards. |
Trader and technical analyst living in Bern, Switzerland. A full member of the STA, currently enrolled in the DITA program and the CMT program.
| Address: | Switzerland |
| E-mail address: | luispgsf@yahoo.com |
Click here for more information about our publications!
Comments
Date: 07/12/06Rank: 3Comment:
Date: 07/14/06Rank: Comment: si le H Sh annoncé se produit, cela signifie le café à 65 cts ,ce qui nécessite des récoltes record...
J.Fontaine eniatnof@bluewin.ch
Date: 07/18/06Rank: 5Comment:

Request Information From Our Sponsors
- StockCharts.com, Inc.
- Candle Patterns
- Candlestick Charting Explained
- Intermarket Technical Analysis
- John Murphy on Chart Analysis
- John Murphy's Chart Pattern Recognition
- John Murphy's Market Message
- MurphyExplainsMarketAnalysis-Intermarket Analysis
- MurphyExplainsMarketAnalysis-Visual Analysis
- StockCharts.com
- Technical Analysis of the Financial Markets
- The Visual Investor
- VectorVest, Inc.
- Executive Premier Workshop
- One-Day Options Course
- OptionsPro
- Retirement Income Workshop
- Sure-Fire Trading Systems (VectorVest, Inc.)
- Trading as a Business Workshop
- VectorVest 7 EOD
- VectorVest 7 RealTime/IntraDay
- VectorVest AutoTester
- VectorVest Educational Services
- VectorVest OnLine
- VectorVest Options Analyzer
- VectorVest ProGraphics v6.0
- VectorVest ProTrader 7
- VectorVest RealTime Derby Tool
- VectorVest Simulator
- VectorVest Variator
- VectorVest Watchdog
