HOT TOPICS LIST
- MACD
- Fibonacci
- RSI
- Gann
- ADXR
- Stochastics
- Volume
- Triangles
- Futures
- Cycles
- Volatility
- ZIGZAG
- MESA
- Retracement
- Aroon
INDICATORS LIST
LIST OF TOPICS
PRINT THIS ARTICLE
by Paolo Pezzutti
Bonds hit a double low and presented divergences in the short and intermediate term.
Position: Accumulate
Paolo Pezzutti
Author of the book "Trading the US Markets - A Comprehensive Guide to US Markets for International Traders and Investors" - Harriman House (July 2008)
PRINT THIS ARTICLE
TECHNICAL ANALYSIS
For The 30-Year T-Bond Contract, The Correction Might Be Over
07/10/06 08:15:55 AMby Paolo Pezzutti
Bonds hit a double low and presented divergences in the short and intermediate term.
Position: Accumulate
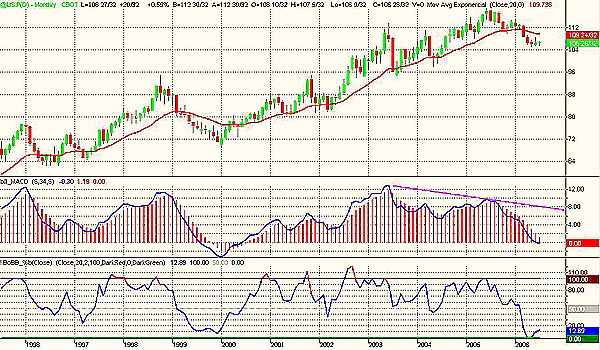
| In Figure 1, the monthly chart displays the negative divergence of the moving average convergence/divergence (MACD) printed last year in June. Since then, prices have started a correction that brought prices back to the August 2004 levels. Prices are still below the moving average. Volatility printed extremely low values that were touched last time back in 1993. The Bollinger %b(close) indicator entered the oversold area. This indicator is used to tell us where we are within the bands. Unlike typical oscillators like stochastics, which are bounded by zero and 100, %b can assume negative values and values above 100 when prices are outside of the bands. At 100, we are at the upper band, while at zero we are at the lower band. Above 100, we are above the upper bands and below zero we are below the lower band. It is a real relative tool, with no absolute information. During this correction, for the first time since 1987, the %b(close) went oversold, reaching the zero level. In this time frame, we still have no evidence that the correction is over. The way the movement developed, however, makes me believe that we are not assisting a reversal of the long-term trend in interest rates, but rather to a long pause of the up move. |

|
| FIGURE 1: US TREASURY BOND, MONTHLY. The correction started a year ago and has been associated to a negative divergence of MACD. |
| Graphic provided by: TradeStation. |
| |
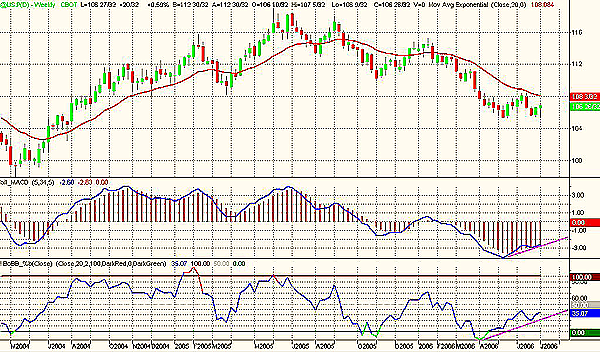
| Figure 2 shows the weekly chart of the Treasury bond. After 12 months of downtrend, it seems that bonds might have found a support. Prices printed a low in May and then managed to start a pullback that found a resistance against the 20-day exponential moving average (EMA), which is still decreasing. The moving average test failed and bonds moved again down to test previous relative lows. The previous week's test of the May low has occurred with lower momentum and both the MACD and the %b(close) indicators are printing a positive divergence. Last week, bonds printed a hammer, which could indicate that these levels might represent a valid support. In addition, in this time frame volatility is at extremely low levels. So far, the correction does not have the characteristics of an impulse to the downside, meaning a structural change of interest rates. Rather, it indicates that in the long term, although it's clear that there is no room for prices to continue to the upside above the record highs of 2005, it is likely we will see a sideway phase with ample swings. This view could be also supported by considerations about commodity prices, global growth, and the continued productivity increase that supports a scenario of a low to moderate interest rate level. |

|
| FIGURE 2: US T-BOND, WEEKLY. A positive divergence of the indicators and the hammer printed last week signal a possibility that a support might have been found in this time frame. |
| Graphic provided by: TradeStation. |
| |
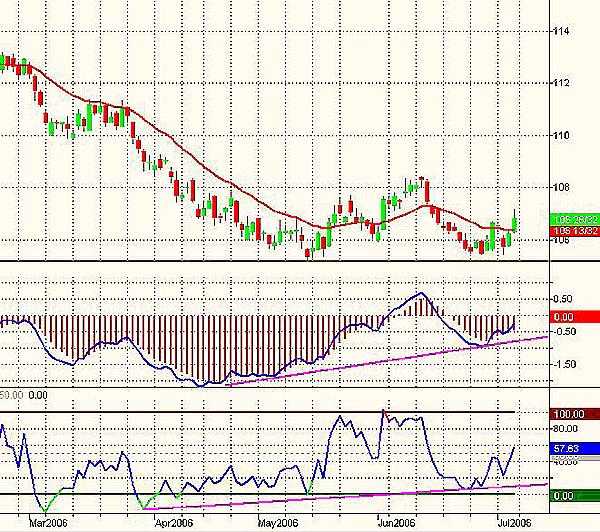
| In the daily time frame, from the relative high of January 2006, bonds lost about 10 points to print a low at about 105 in May. In Figure 3, the double low printed in June occurred in coincidence with a very significant positive divergence of MACD and the %b(close) indicators. On June 30, bonds printed a long white candle, initiating a rebound; 105 is now a significant support that should hold in the short term. Also in the intermediate time frame, it is likely there will be at least a pause in the movement to lower prices and therefore higher interest rates. From a technical perspective, prices could continue the rebound to test the 108 level. The natural objective of the double low formation is positioned at 110. At these levels, it is possible to consider taking a long position, given the good risk-reward characteristics of the trade. Risk management and stop-loss, in any case, have to be applied with discipline. |

|
| FIGURE 3: US T-BOND, DAILY. The double printed in June has an objective at 108 and then at 100. |
| Graphic provided by: TradeStation. |
| |
Author of the book "Trading the US Markets - A Comprehensive Guide to US Markets for International Traders and Investors" - Harriman House (July 2008)
| Address: | VIA ROBERTO AGO 26 POSTAL CODE 00166 |
| Rome, ITALY | |
| Phone # for sales: | +393357540708 |
| E-mail address: | pezzutti.paolo@tiscali.it |
Click here for more information about our publications!
Comments
Date: 07/11/06Rank: 5Comment:
Date: 07/12/06Rank: 4Comment:
Date: 07/12/06Rank: 3Comment:

Request Information From Our Sponsors
- StockCharts.com, Inc.
- Candle Patterns
- Candlestick Charting Explained
- Intermarket Technical Analysis
- John Murphy on Chart Analysis
- John Murphy's Chart Pattern Recognition
- John Murphy's Market Message
- MurphyExplainsMarketAnalysis-Intermarket Analysis
- MurphyExplainsMarketAnalysis-Visual Analysis
- StockCharts.com
- Technical Analysis of the Financial Markets
- The Visual Investor
- VectorVest, Inc.
- Executive Premier Workshop
- One-Day Options Course
- OptionsPro
- Retirement Income Workshop
- Sure-Fire Trading Systems (VectorVest, Inc.)
- Trading as a Business Workshop
- VectorVest 7 EOD
- VectorVest 7 RealTime/IntraDay
- VectorVest AutoTester
- VectorVest Educational Services
- VectorVest OnLine
- VectorVest Options Analyzer
- VectorVest ProGraphics v6.0
- VectorVest ProTrader 7
- VectorVest RealTime Derby Tool
- VectorVest Simulator
- VectorVest Variator
- VectorVest Watchdog
