HOT TOPICS LIST
- MACD
- Fibonacci
- RSI
- Gann
- ADXR
- Stochastics
- Volume
- Triangles
- Futures
- Cycles
- Volatility
- ZIGZAG
- MESA
- Retracement
- Aroon
INDICATORS LIST
LIST OF TOPICS
PRINT THIS ARTICLE
by Koos van der Merwe
With most financial writers today becoming more and more bearish about the market, is it time to sell everything and buy gold?
Position: Sell
Koos van der Merwe
Has been a technical analyst since 1969, and has worked as a futures and options trader with First Financial Futures in Johannesburg, South Africa.
PRINT THIS ARTICLE
DECLINING TREND
Sell Stocks And Buy Gold?
07/07/06 10:50:46 AMby Koos van der Merwe
With most financial writers today becoming more and more bearish about the market, is it time to sell everything and buy gold?
Position: Sell
| The old saying goes, "All roads lead to Rome." With so many chartists writing about an impending bull market crash, does this mean that "all charts lead to a crash"? |
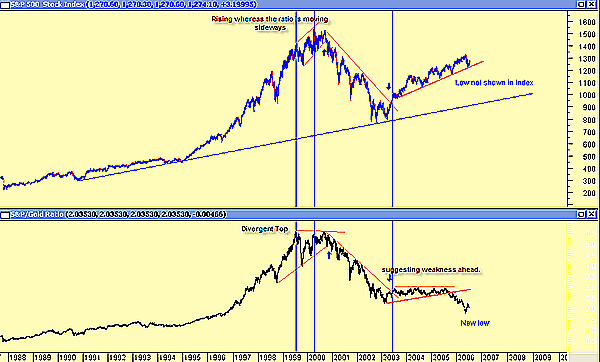
| My recent Traders.com Advantage articles have clearly shown that should the charts be correct, then a major correction is due in the near future. Rather than visit a psychologist to fortify my beliefs and decision to sell everything and go to cash, I am always looking for verification by other analysts and chartists, trying to find the latest time to sell. Then again, perhaps I should take a contrarian attitude and decide that with everyone bearish, shouldn't I be bullish? With this in mind, when I saw Figure 1, I asked myself, "Is it telling me anything that I don't know already? Is it confirming what my wave and Gann charts are already telling me?" and finally, "Must I start buying gold shares?" Remember, gold prices typically lead commodities at both tops and bottoms, or so says Martin Pring of Pring Research in his article at Pring.com, "The Return of the Bear," on June 17, 2006. "Trend reversals in the stock/gold ratio also warn of an impending U-turn in equities," he adds. |

|
| FIGURE 1: SPX, GOLD. Here's the ratio of the S&P 500 to London gold. |
| Graphic provided by: MetaStock. |
| |
| The chart shows the trendlines for both the Standard & Poor's 500 and its ratio to the London gold price. The recent trendline (thick) has been broken by the ratio, but not broken by the S&P 500. The blue arrows broke the trendlines within a few weeks of each other, leading to a reversal. Note, too, the lack of enthusiasm by the ratio as the S&P 500 made new highs in 2000. Currently, the ratio is at a new cyclical low, which appears ominous for the long term. Should the S&P 500 break below its support line, we could expect the start of a major bear market. Is the chart telling us to buy gold when this happens? Not necessarily, but it is telling us that this could be an option to consider. |
Has been a technical analyst since 1969, and has worked as a futures and options trader with First Financial Futures in Johannesburg, South Africa.
| Address: | 3256 West 24th Ave |
| Vancouver, BC | |
| Phone # for sales: | 6042634214 |
| E-mail address: | petroosp@gmail.com |
Click here for more information about our publications!
Comments
Date: 07/07/06Rank: 2Comment:
Date: 07/11/06Rank: 5Comment:
Date: 07/11/06Rank: 4Comment:

Request Information From Our Sponsors
- StockCharts.com, Inc.
- Candle Patterns
- Candlestick Charting Explained
- Intermarket Technical Analysis
- John Murphy on Chart Analysis
- John Murphy's Chart Pattern Recognition
- John Murphy's Market Message
- MurphyExplainsMarketAnalysis-Intermarket Analysis
- MurphyExplainsMarketAnalysis-Visual Analysis
- StockCharts.com
- Technical Analysis of the Financial Markets
- The Visual Investor
- VectorVest, Inc.
- Executive Premier Workshop
- One-Day Options Course
- OptionsPro
- Retirement Income Workshop
- Sure-Fire Trading Systems (VectorVest, Inc.)
- Trading as a Business Workshop
- VectorVest 7 EOD
- VectorVest 7 RealTime/IntraDay
- VectorVest AutoTester
- VectorVest Educational Services
- VectorVest OnLine
- VectorVest Options Analyzer
- VectorVest ProGraphics v6.0
- VectorVest ProTrader 7
- VectorVest RealTime Derby Tool
- VectorVest Simulator
- VectorVest Variator
- VectorVest Watchdog
