HOT TOPICS LIST
- MACD
- Fibonacci
- RSI
- Gann
- ADXR
- Stochastics
- Volume
- Triangles
- Futures
- Cycles
- Volatility
- ZIGZAG
- MESA
- Retracement
- Aroon
INDICATORS LIST
LIST OF TOPICS
PRINT THIS ARTICLE
by Paolo Pezzutti
The DJ Internet Commerce Index prints a relative top and moves to the downside to test previous lows.
Position: N/A
Paolo Pezzutti
Author of the book "Trading the US Markets - A Comprehensive Guide to US Markets for International Traders and Investors" - Harriman House (July 2008)
PRINT THIS ARTICLE
CANDLESTICK CHARTING
Candlestick Filtering: The Stochastics
07/07/06 09:49:18 AMby Paolo Pezzutti
The DJ Internet Commerce Index prints a relative top and moves to the downside to test previous lows.
Position: N/A
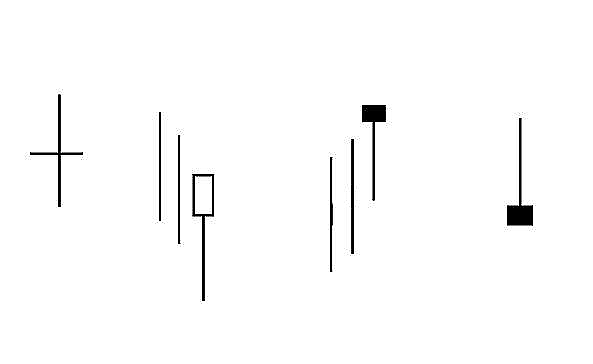
| Candlestick charting signals can be used in conjunction with Western indicators to improve the results. Many indicators can be utilized to find confirmation of the indications provided by the candlesticks. As you know, candlesticks have the advantage of delineating a type of visualization that is very effective compared with traditional open-high-low-close (OHLC) bars. The main candlestick patterns are the following (Figures 1, 2, 3): Doji (DJ): This pattern occurs when the open and the close are the same. It is a significant reversal indicator, depicting traders' indecision. Hammer (HA): The body (the color is not important) is small and at the upper part of the range. The shadow should be twice the height of the real upper body. It should have no or very short upper shadow. It is usually bullish after a selloff. Hanging Man (HM): It has the same characteristics of a hammer. It is considered bearish after a rally. Shooting Star (SS): It has a small real body at the lower end of its range with a long upper shadow. An ideal shooting star has a real body that gaps away from the prior real body. The shooting star is a warning of an impending top. Inverted Hammer (IH): It is a shooting star–shaped candlestick. In a falling market, it could be a bullish signal. The inverted hammer signals the possibility of a bottom. |

|
| FIGURE 1: SOME MAJOR CANDLESTICK PATTERNS. A doji, a hammer at the end of a falling market, a hanging man after a rally, and a shooting star. |
| Graphic provided by: PowerPoint. |
| |
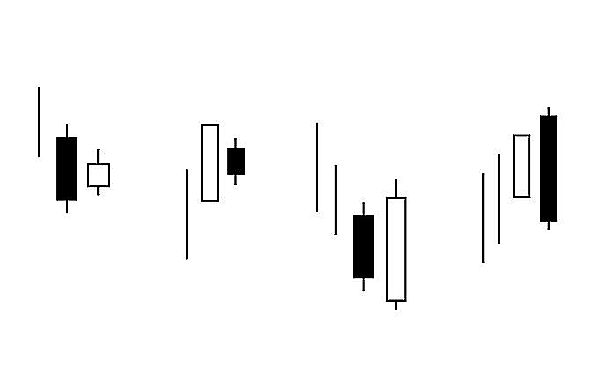
| Bullish Harami (BUH): It is a small real body contained within a prior, unusually black long real body. In a falling market, it could provide a bullish signal. Bearish Harami (BEH): The small real body is contained within a prior, unusually white long real body. In a rallying market, it could provide a bearish signal. Bullish Engulfing (BUE): It is a major reversal signal with two opposite-color real bodies making up this pattern. The market is in a downtrend, then a white bullish real body engulfs the prior period's black real body. Bearish Engulfing (BEE): The market is trending higher. The white real body is engulfed by a black body. It is the signal for a top reversal. |

|
| FIGURE 2: MORE MAJOR CANDLESTICK PATTERNS. A bullish harami formed after a down move, a bearish harami at a top, a bullish engulfing at the end of a down market, and a bearish engulfing at the end of a rally. |
| Graphic provided by: powerpoint. |
| |
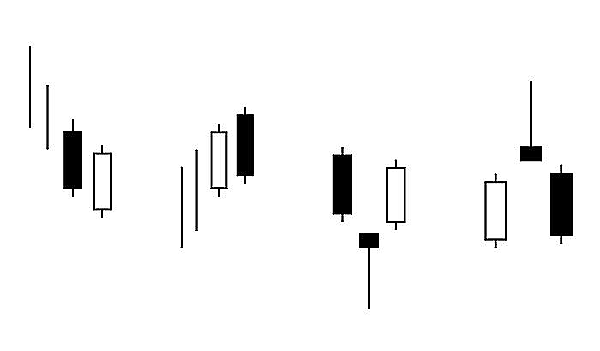
| Dark Cloud (DC): It is a two-candlestick pattern. It is a top reversal after an uptrend. The first day is a strong white real body. The second day's price opens above the prior session's high, and by the end of the second day's session, the market closes near the low of the day and well within the prior day's white body. Piercing (PI): It is the opposite of a dark cloud. It is a bottom reversal. It is composed of two candlesticks in a downtrend. The first candlestick is a black real body day and the second is a long, white real body day. This white day opens under the low of the prior black day. Prices then move higher, creating a white real body that closes above the midrange of the prior day's black real body. Morning Star (MS): It is a bottom reversal pattern. The first candle has a long, black real body. It is followed by a small real body that gaps lower. The third day is a white real body that moves well within the first day's black real body. Evening Star (ES): It is the opposite of the morning star pattern. The first candle has a white real body, followed by a star. The third day prints a black real body that moves sharply into the first day's white real body. |

|
| FIGURE 3: MORE MAJOR PATTERNS. A piercing pattern in a falling market, a dark cloud near a top, a morning star, and an evening star. |
| Graphic provided by: powerpoint. |
| |
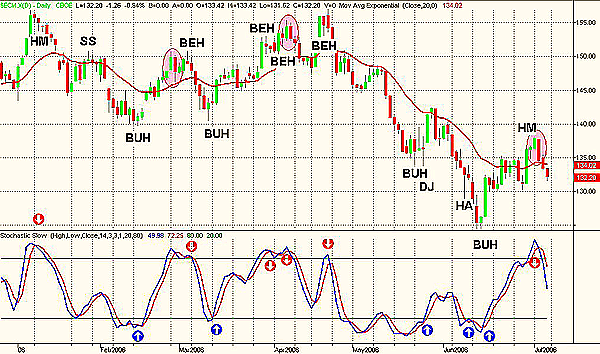
| If you associate, for example, an oscillator to confirm the technical indications provided by the candlestick patterns, you may have useful practical trading signals. Suppose you decide to use the stochastics. Overbought and oversold levels qualify bullish and bearish patterns. For example, with the stochastic oversold, the doji, bullish harami, bullish engulfing, piercing, morning star, and hammer might provide bullish indications of short-term entry points with specific stop-loss signals should the patterns fail. The opposite applies when the the stochastic is overbought and the doji, bearish harami, bearish engulfing, dark cloud, evening star, and hanging man provide bearish indications. |

|
| FIGURE 4: DJ INTERNET COMMERCE INDEX, DAILY. Candlestick patterns, during this period, have been very useful when associated to an oscillator, diminishing the number of false signals. The index has now entered a phase of weakness as correctly indicated by the candlestick and the stochastic oscillator. |
| Graphic provided by: TradeStation. |
| |
| In Figure 4, you can see the CBOE DJ Internet Commerce Index ($ECM). Note that the stochastics associated to the candlestick patterns provided useful indications about the reversal potential of the trend. The approach cannot be fully mechanized, however; it may be very useful to traders who make decisions based on sound methodologies. Candlestick patterns have the advantage to help traders assess technical conditions easily and quickly. Note that, in this case, there were many harami printed. Most of the times, the signals were correct, although you have to expect false signals as well. When they occur, it is important to apply risk management rules with discipline. To see an example, let's analyze the technical situation. On June 8, at the end of a long and steep downtrend, the index printed a very nice hammer. The shadow is very long and the body is small. The only thing was that prices did not manage to close above the open. You would expect this to be a valid support, but the index printed three consecutive negative sessions moving to new lows, clearly a losing trade. Prices managed to trap the last bears, however. On June 15, a bullish harami was confirmed by a very long up day, which initiated a two-week rebound and provided good profits this time. On June 30, a hanging man pattern signaled possible weakness, as the stochastic was overbought. Two days later, a long negative candle initiated the ongoing move, which is now going to test the important support of the star printed on June 28 at 131. The stochastic is moving toward the oversold area, and there are no signs of an inversion to the upside so far. |
Author of the book "Trading the US Markets - A Comprehensive Guide to US Markets for International Traders and Investors" - Harriman House (July 2008)
| Address: | VIA ROBERTO AGO 26 POSTAL CODE 00166 |
| Rome, ITALY | |
| Phone # for sales: | +393357540708 |
| E-mail address: | pezzutti.paolo@tiscali.it |
Click here for more information about our publications!
Comments
Date: 07/07/06Rank: 4Comment:
Date: 07/08/06Rank: 1Comment:
Date: 07/11/06Rank: 5Comment:
Date: 07/11/06Rank: 5Comment:
Date: 07/20/06Rank: 5Comment:
Date: 11/08/06Rank: 5Comment:
Date: 04/26/08Rank: 5Comment:
Date: 04/29/08Rank: 5Comment:

Request Information From Our Sponsors
- StockCharts.com, Inc.
- Candle Patterns
- Candlestick Charting Explained
- Intermarket Technical Analysis
- John Murphy on Chart Analysis
- John Murphy's Chart Pattern Recognition
- John Murphy's Market Message
- MurphyExplainsMarketAnalysis-Intermarket Analysis
- MurphyExplainsMarketAnalysis-Visual Analysis
- StockCharts.com
- Technical Analysis of the Financial Markets
- The Visual Investor
- VectorVest, Inc.
- Executive Premier Workshop
- One-Day Options Course
- OptionsPro
- Retirement Income Workshop
- Sure-Fire Trading Systems (VectorVest, Inc.)
- Trading as a Business Workshop
- VectorVest 7 EOD
- VectorVest 7 RealTime/IntraDay
- VectorVest AutoTester
- VectorVest Educational Services
- VectorVest OnLine
- VectorVest Options Analyzer
- VectorVest ProGraphics v6.0
- VectorVest ProTrader 7
- VectorVest RealTime Derby Tool
- VectorVest Simulator
- VectorVest Variator
- VectorVest Watchdog
