HOT TOPICS LIST
- MACD
- Fibonacci
- RSI
- Gann
- ADXR
- Stochastics
- Volume
- Triangles
- Futures
- Cycles
- Volatility
- ZIGZAG
- MESA
- Retracement
- Aroon
INDICATORS LIST
LIST OF TOPICS
PRINT THIS ARTICLE
by Arthur Hill
With a breakout to new highs, Merck continues to outperform its peers in the S&P 500 and health-care sector.
Position: Accumulate
Arthur Hill
Arthur Hill is currently editor of TDTrader.com, a website specializing in trading strategies, sector/industry specific breadth stats and overall technical analysis. He passed the Society of Technical Analysts (STA London) diploma exam with distinction is a Certified Financial Technician (CFTe). Prior to TD Trader, he was the Chief Technical Analyst for Stockcharts.com and the main contributor to the ChartSchool.
PRINT THIS ARTICLE
REL. STR COMPARATIVE
A Nice Breakout For Merck
07/07/06 08:30:00 AMby Arthur Hill
With a breakout to new highs, Merck continues to outperform its peers in the S&P 500 and health-care sector.
Position: Accumulate
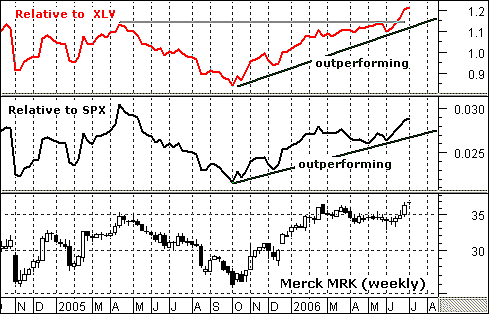
| There are two price relatives in Figure 1. The black one compares Merck to the Standard & Poor's 500 and shows how the stock is performing against the broader market. The red one compares Merck to the health-care SPDR (XLV) and shows how Merck is performing against its sector. The sector price relative (MRK/XLV) bottomed in October and recorded a new 52-week high last week. This shows that Merck is one of the strongest stocks in the health-care sectors. The broad market price relative (MRK/SPX) also bottomed in October, but has yet to record a 52-week high. Nevertheless, this price relative has been trending higher since October, and Merck has been stronger than this benchmark index. |

|
| FIGURE 1: MERCK, WEEKLY. There are two price relatives shown here: MRK is compared to the S&P 500 and to the health-care SPDR. |
| Graphic provided by: MetaStock. |
| |
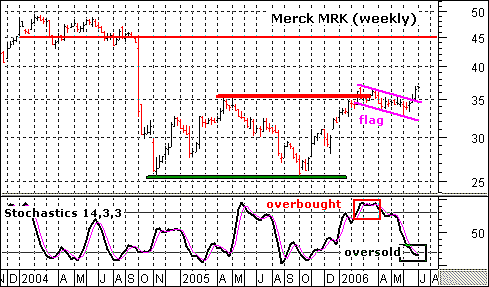
| The stock also shows plenty of strength on the price chart. MRK recorded a 52-week high in February and the stochastic oscillator became overbought (red box, Figure 2). The stocks fell back over the last few months and a falling flag formed. This represented a correction of the October–February advance and it alleviated the overbought condition. Note that the stochastic oscillator moved below 20 and is not oversold. |

|
| FIGURE 2: MERCK, WEEKLY. MRK recorded a 52-week high in February and the stochastic oscillator became overbought (red box). |
| Graphic provided by: MetaStock. |
| |
| This oversold condition is not likely to last long, as the stock broke above the upper flag trendline and moved above its May high. The breakout is strong and signals a continuation of the October–February advance. In addition, the stock notched another 52-week high, and this is even more impressive when we consider relative weakness in the overall market. The next resistance level is around 45 and this is the upside target over the next few months. |
Arthur Hill is currently editor of TDTrader.com, a website specializing in trading strategies, sector/industry specific breadth stats and overall technical analysis. He passed the Society of Technical Analysts (STA London) diploma exam with distinction is a Certified Financial Technician (CFTe). Prior to TD Trader, he was the Chief Technical Analyst for Stockcharts.com and the main contributor to the ChartSchool.
| Title: | Editor |
| Company: | TDTrader.com |
| Address: | Willem Geetsstraat 17 |
| Mechelen, B2800 | |
| Phone # for sales: | 3215345465 |
| Website: | www.tdtrader.com |
| E-mail address: | arthurh@tdtrader.com |
Traders' Resource Links | |
| TDTrader.com has not added any product or service information to TRADERS' RESOURCE. | |
Click here for more information about our publications!
Comments
Date: 07/07/06Rank: 4Comment:
Date: 07/08/06Rank: 4Comment:
Date: 07/08/06Rank: 4Comment: why 52 week high is so important?Comparing Merck to the health-care SPDR (XLV)-how did you combine that in one line on the graph.
Very helpful article.
Thank you

Request Information From Our Sponsors
- StockCharts.com, Inc.
- Candle Patterns
- Candlestick Charting Explained
- Intermarket Technical Analysis
- John Murphy on Chart Analysis
- John Murphy's Chart Pattern Recognition
- John Murphy's Market Message
- MurphyExplainsMarketAnalysis-Intermarket Analysis
- MurphyExplainsMarketAnalysis-Visual Analysis
- StockCharts.com
- Technical Analysis of the Financial Markets
- The Visual Investor
- VectorVest, Inc.
- Executive Premier Workshop
- One-Day Options Course
- OptionsPro
- Retirement Income Workshop
- Sure-Fire Trading Systems (VectorVest, Inc.)
- Trading as a Business Workshop
- VectorVest 7 EOD
- VectorVest 7 RealTime/IntraDay
- VectorVest AutoTester
- VectorVest Educational Services
- VectorVest OnLine
- VectorVest Options Analyzer
- VectorVest ProGraphics v6.0
- VectorVest ProTrader 7
- VectorVest RealTime Derby Tool
- VectorVest Simulator
- VectorVest Variator
- VectorVest Watchdog
