HOT TOPICS LIST
- MACD
- Fibonacci
- RSI
- Gann
- ADXR
- Stochastics
- Volume
- Triangles
- Futures
- Cycles
- Volatility
- ZIGZAG
- MESA
- Retracement
- Aroon
INDICATORS LIST
LIST OF TOPICS
PRINT THIS ARTICLE
by David Penn
Lows in June have provided for tradable bounces in many markets. The next measure of strength will be in how these markets handle the inevitable distribution.
Position: N/A
David Penn
Technical Writer for Technical Analysis of STOCKS & COMMODITIES magazine, Working-Money.com, and Traders.com Advantage.
PRINT THIS ARTICLE
FIBONACCI
Extended To The Upside
07/07/06 08:19:55 AMby David Penn
Lows in June have provided for tradable bounces in many markets. The next measure of strength will be in how these markets handle the inevitable distribution.
Position: N/A
| The funny thing about "summer rallies" is that everybody talks about them every single year. But when they arrive, you can't throw a chartbook across the room without hitting a skeptic. Some market observers appear at times to be so overwhelmed by their correctness in calling the low that tends to precede summer rallies that they forget to doff their bear caps and don their bull caps when the inevitable bottom does in fact arrive. |

|
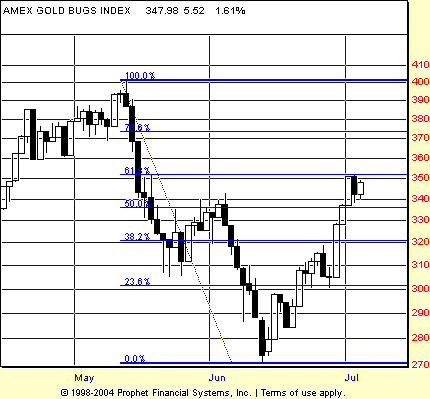
| FIGURE 1: AMEX GOLD BUGS INDEX, DAILY. Having cleared resistance in the form of June highs, the $HUI now appears to have found additional resistance at the 61.8% retracement level from the May highs. Some sideways movement between 340 and 350 should not surprise if it occurs. |
| Graphic provided by: Prophet Financial, Inc. |
| |
| At the same time, those clever or merely fortunate enough to catch a market near its bottom need to be wary of greed. In the same way that markets breaking out to new highs can become overextended and ripe for correction or reversal, so can markets surging higher after establishing tradable short- or intermediate-term bottoms. |
| The markets are currently providing us with an opportunity to verify this phenomenon. Looking at gold stocks represented in Figure 1, for example, we can see a strong move higher in the second half of June. This move was so strong that it blew through resistance in the form of the June highs in a single session. Since then, $HUI has begun a sideways movement indicative of some measure of consolidation, during which accumulation (for those who missed the bottom in midmonth) and distribution (for those who were long the market near midmonth) should take place. |

|
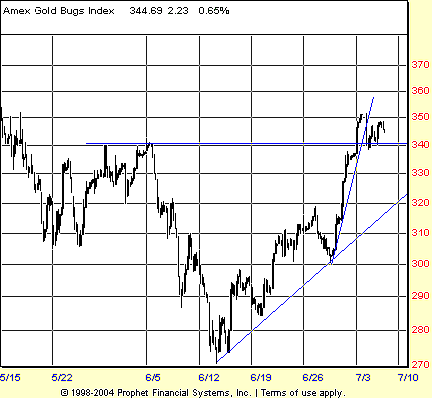
| FIGURE 2: AMEX GOLD BUGS INDEX, HOURLY. The near-vertical ascent in gold stocks over the past several days makes for a market that will need to consolidate or correct before being able to move significantly higher. |
| Graphic provided by: Prophet Financial, Inc. |
| |
| The hourly chart in Figure 2 perhaps does an even better job than the daily chart in Figure 1 in terms of showing just how dramatically vertical the rise in gold stocks has been since late June. If the rally from the midmonth lows was sharp but sustainable, then what can be said of the rally since the June 28th low (the last time the market touched the "old" trendline)? |
| The first test of the $HUI rally will be to see if it can turn former resistance at the 340 level into support. Failing that, the next level of significant support appears to be at 320, which represents a previous high in the current rally and a pullback to the 38.2% retracement level. |
Technical Writer for Technical Analysis of STOCKS & COMMODITIES magazine, Working-Money.com, and Traders.com Advantage.
| Title: | Technical Writer |
| Company: | Technical Analysis, Inc. |
| Address: | 4757 California Avenue SW |
| Seattle, WA 98116 | |
| Phone # for sales: | 206 938 0570 |
| Fax: | 206 938 1307 |
| Website: | www.Traders.com |
| E-mail address: | DPenn@traders.com |
Traders' Resource Links | |
| Charting the Stock Market: The Wyckoff Method -- Books | |
| Working-Money.com -- Online Trading Services | |
| Traders.com Advantage -- Online Trading Services | |
| Technical Analysis of Stocks & Commodities -- Publications and Newsletters | |
| Working Money, at Working-Money.com -- Publications and Newsletters | |
| Traders.com Advantage -- Publications and Newsletters | |
| Professional Traders Starter Kit -- Software | |
Click here for more information about our publications!
Comments
Date: 07/07/06Rank: 4Comment:
Date: 07/12/06Rank: 5Comment:

Request Information From Our Sponsors
- StockCharts.com, Inc.
- Candle Patterns
- Candlestick Charting Explained
- Intermarket Technical Analysis
- John Murphy on Chart Analysis
- John Murphy's Chart Pattern Recognition
- John Murphy's Market Message
- MurphyExplainsMarketAnalysis-Intermarket Analysis
- MurphyExplainsMarketAnalysis-Visual Analysis
- StockCharts.com
- Technical Analysis of the Financial Markets
- The Visual Investor
- VectorVest, Inc.
- Executive Premier Workshop
- One-Day Options Course
- OptionsPro
- Retirement Income Workshop
- Sure-Fire Trading Systems (VectorVest, Inc.)
- Trading as a Business Workshop
- VectorVest 7 EOD
- VectorVest 7 RealTime/IntraDay
- VectorVest AutoTester
- VectorVest Educational Services
- VectorVest OnLine
- VectorVest Options Analyzer
- VectorVest ProGraphics v6.0
- VectorVest ProTrader 7
- VectorVest RealTime Derby Tool
- VectorVest Simulator
- VectorVest Variator
- VectorVest Watchdog
